Fig. 5
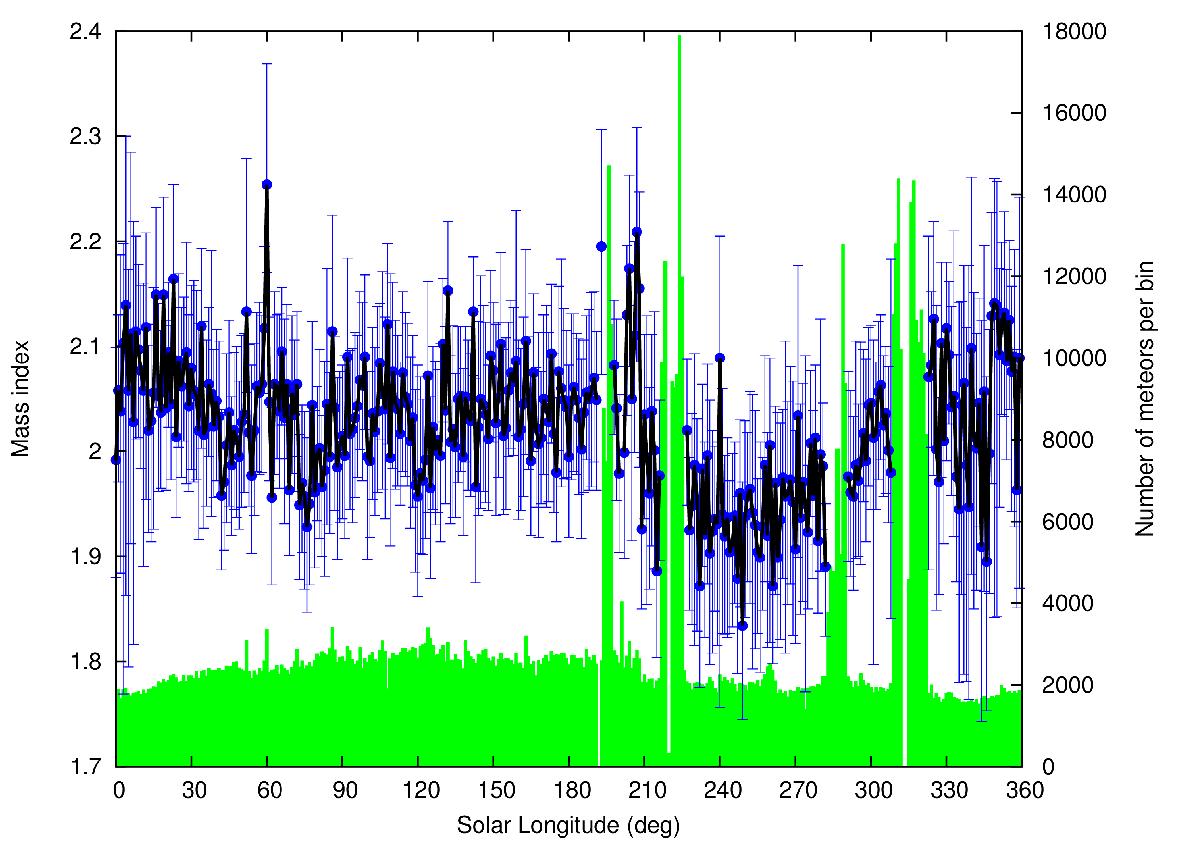
Mass index distribution throughout the whole year 2014 for the sporadic meteoroid complex observed by the 29.85 MHz CMOR radar. Blue points represent the mass index s for a given one degree bin in the solar longitude, where error bars are obtained from the Bayesian posterior equal weight distribution. Green boxes represent the number of meteors in each of one degree bins in the solar longitude. The intervals with large green spikes represent interference and are removed from the analysis.
Current usage metrics show cumulative count of Article Views (full-text article views including HTML views, PDF and ePub downloads, according to the available data) and Abstracts Views on Vision4Press platform.
Data correspond to usage on the plateform after 2015. The current usage metrics is available 48-96 hours after online publication and is updated daily on week days.
Initial download of the metrics may take a while.