Fig. 4
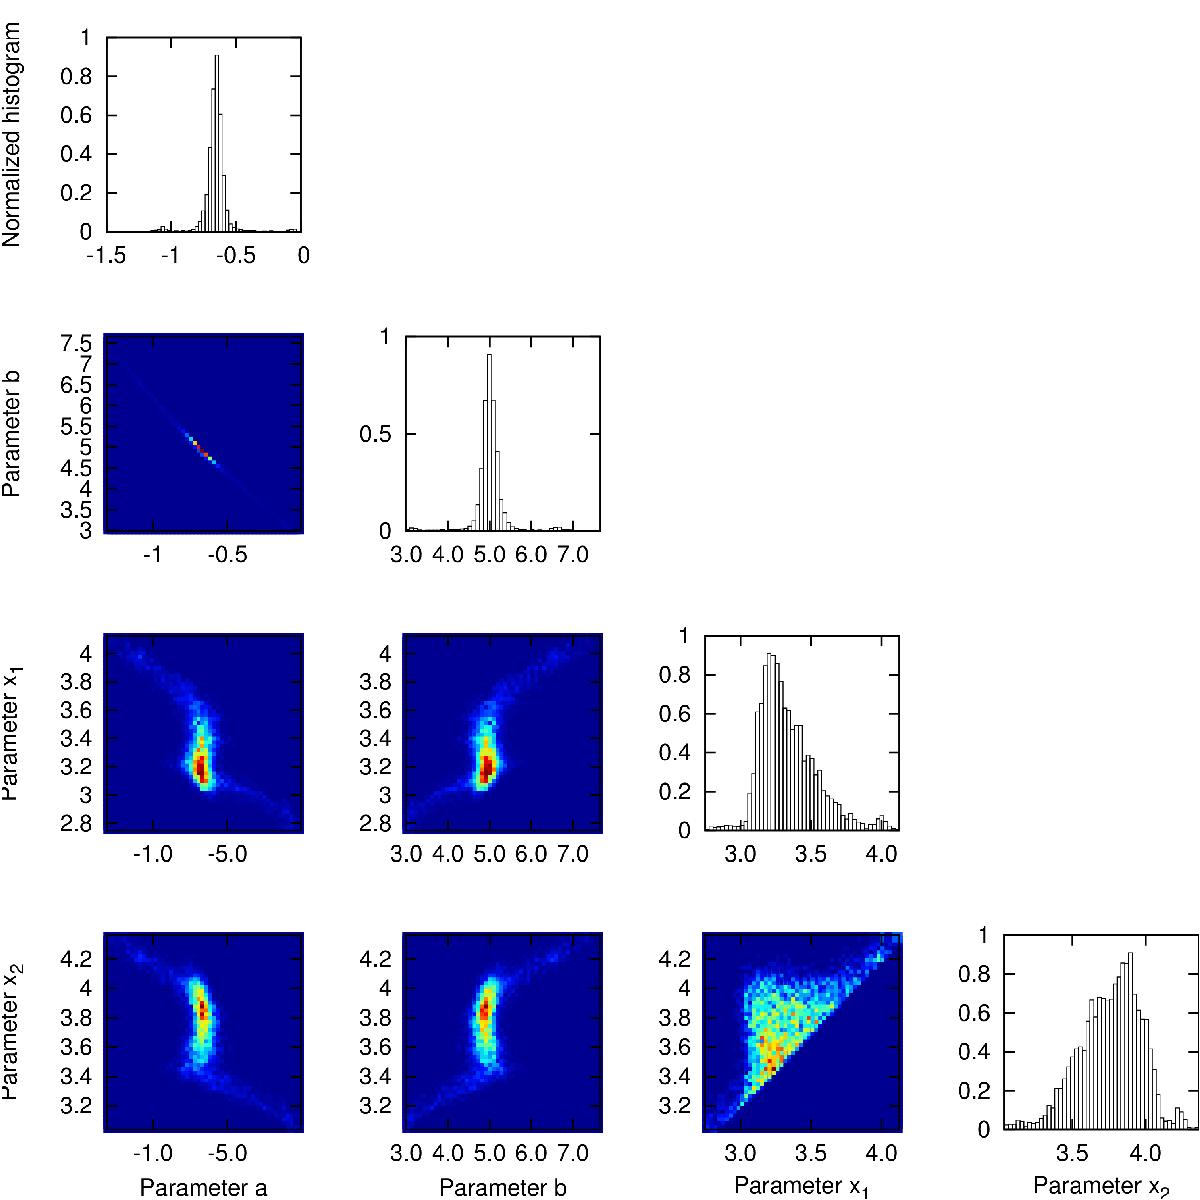
Posterior distribution of four parameters used in our fitting procedure as applied to the Quadrantids meteors shower. Histograms in the outer plots show a distribution of statistically equivalent solutions. The plots inside the triangular structure show projections of these solutions onto two-dimensional planes of two selected parameters, where the color coding represents the density of solutions (increasing in density from blue to red). The graphs (left to right columns) show the distribution and correlation of the following parameters: (1) slope a; (2) offset b; (3) lower bound x1; and (4) upper bound x2.
Current usage metrics show cumulative count of Article Views (full-text article views including HTML views, PDF and ePub downloads, according to the available data) and Abstracts Views on Vision4Press platform.
Data correspond to usage on the plateform after 2015. The current usage metrics is available 48-96 hours after online publication and is updated daily on week days.
Initial download of the metrics may take a while.