Fig. 11
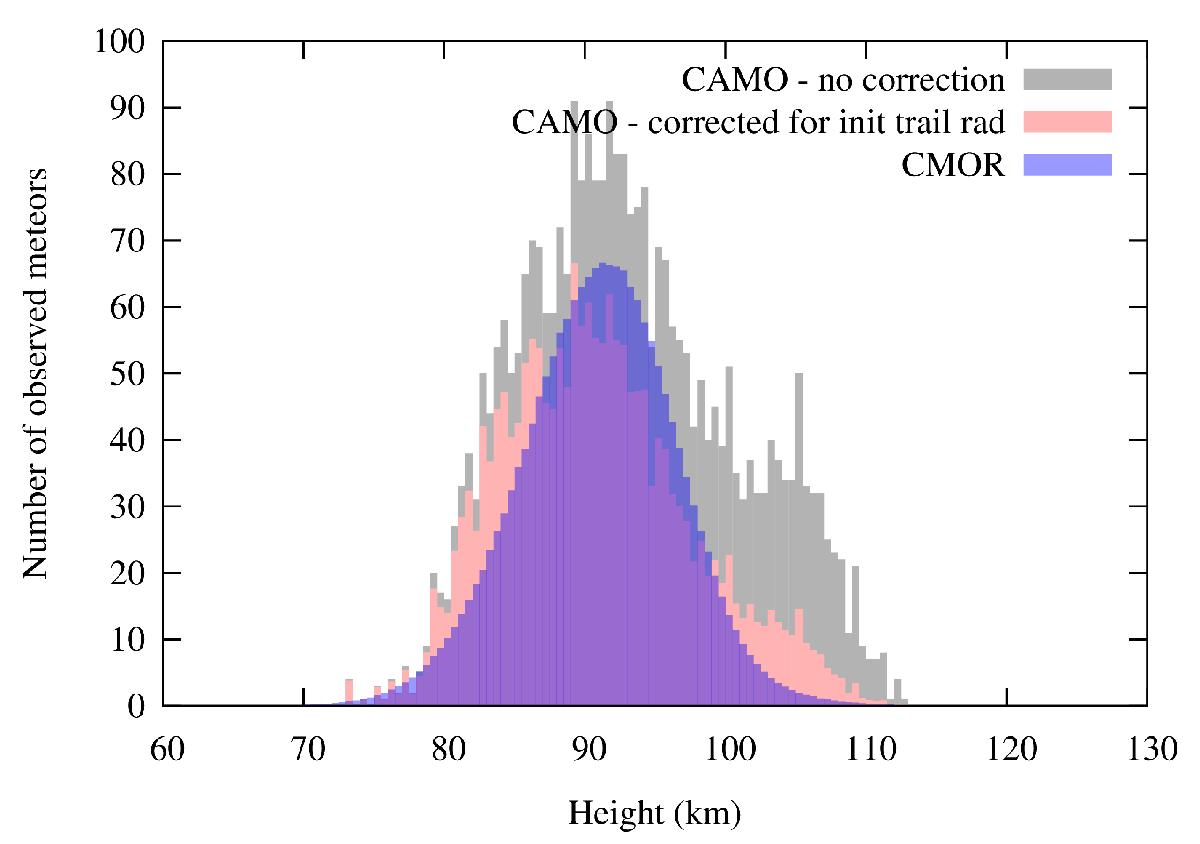
Distribution of heights for uncorrected CAMO data (gray histogram), CAMO data corrected for the initial radius (red histogram), and the 29.85 MHz CMOR heights in 2014 (blue histogram) rescaled to match CAMO corrected distribution. The effect of the correction is evident, minimizing the contribution of meteors with higher heights while keeping meteors with lower heights untouched.
Current usage metrics show cumulative count of Article Views (full-text article views including HTML views, PDF and ePub downloads, according to the available data) and Abstracts Views on Vision4Press platform.
Data correspond to usage on the plateform after 2015. The current usage metrics is available 48-96 hours after online publication and is updated daily on week days.
Initial download of the metrics may take a while.