Fig. 10
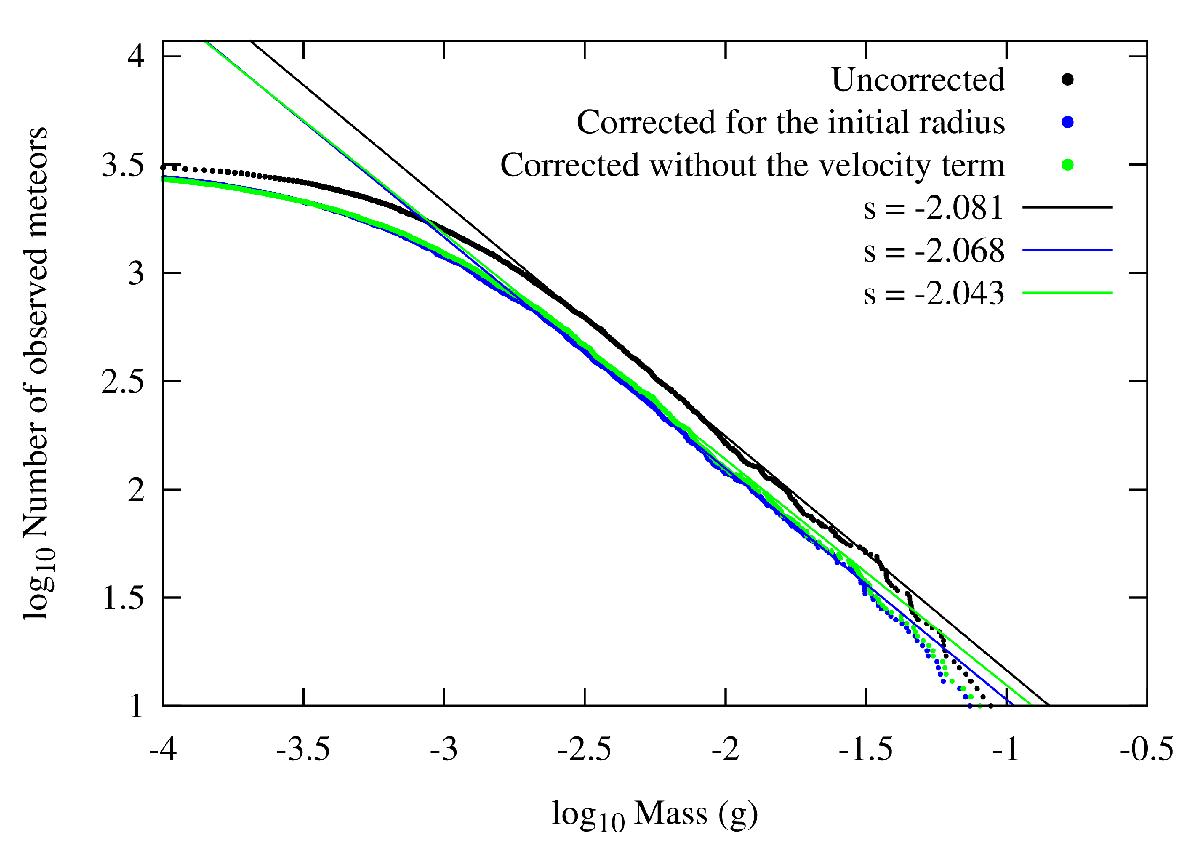
Logarithm of the cumulative number of observed meteors N relative to the logarithm of their mass for meteors observed with CAMO between 2009 and 2012. We show CAMO data not affected by the initial trail radius (black dots) correction with the best fit (black line). This is the true mass index. The distribution once the initial trail radius bias (blue dots) is applied retains an almost identical slope (blue line). We also show the effect of applying the initial radius bias with a velocity term to the distribution and find it produces a negligible difference (green dots and green for the best fit).
Current usage metrics show cumulative count of Article Views (full-text article views including HTML views, PDF and ePub downloads, according to the available data) and Abstracts Views on Vision4Press platform.
Data correspond to usage on the plateform after 2015. The current usage metrics is available 48-96 hours after online publication and is updated daily on week days.
Initial download of the metrics may take a while.