Fig. D.1
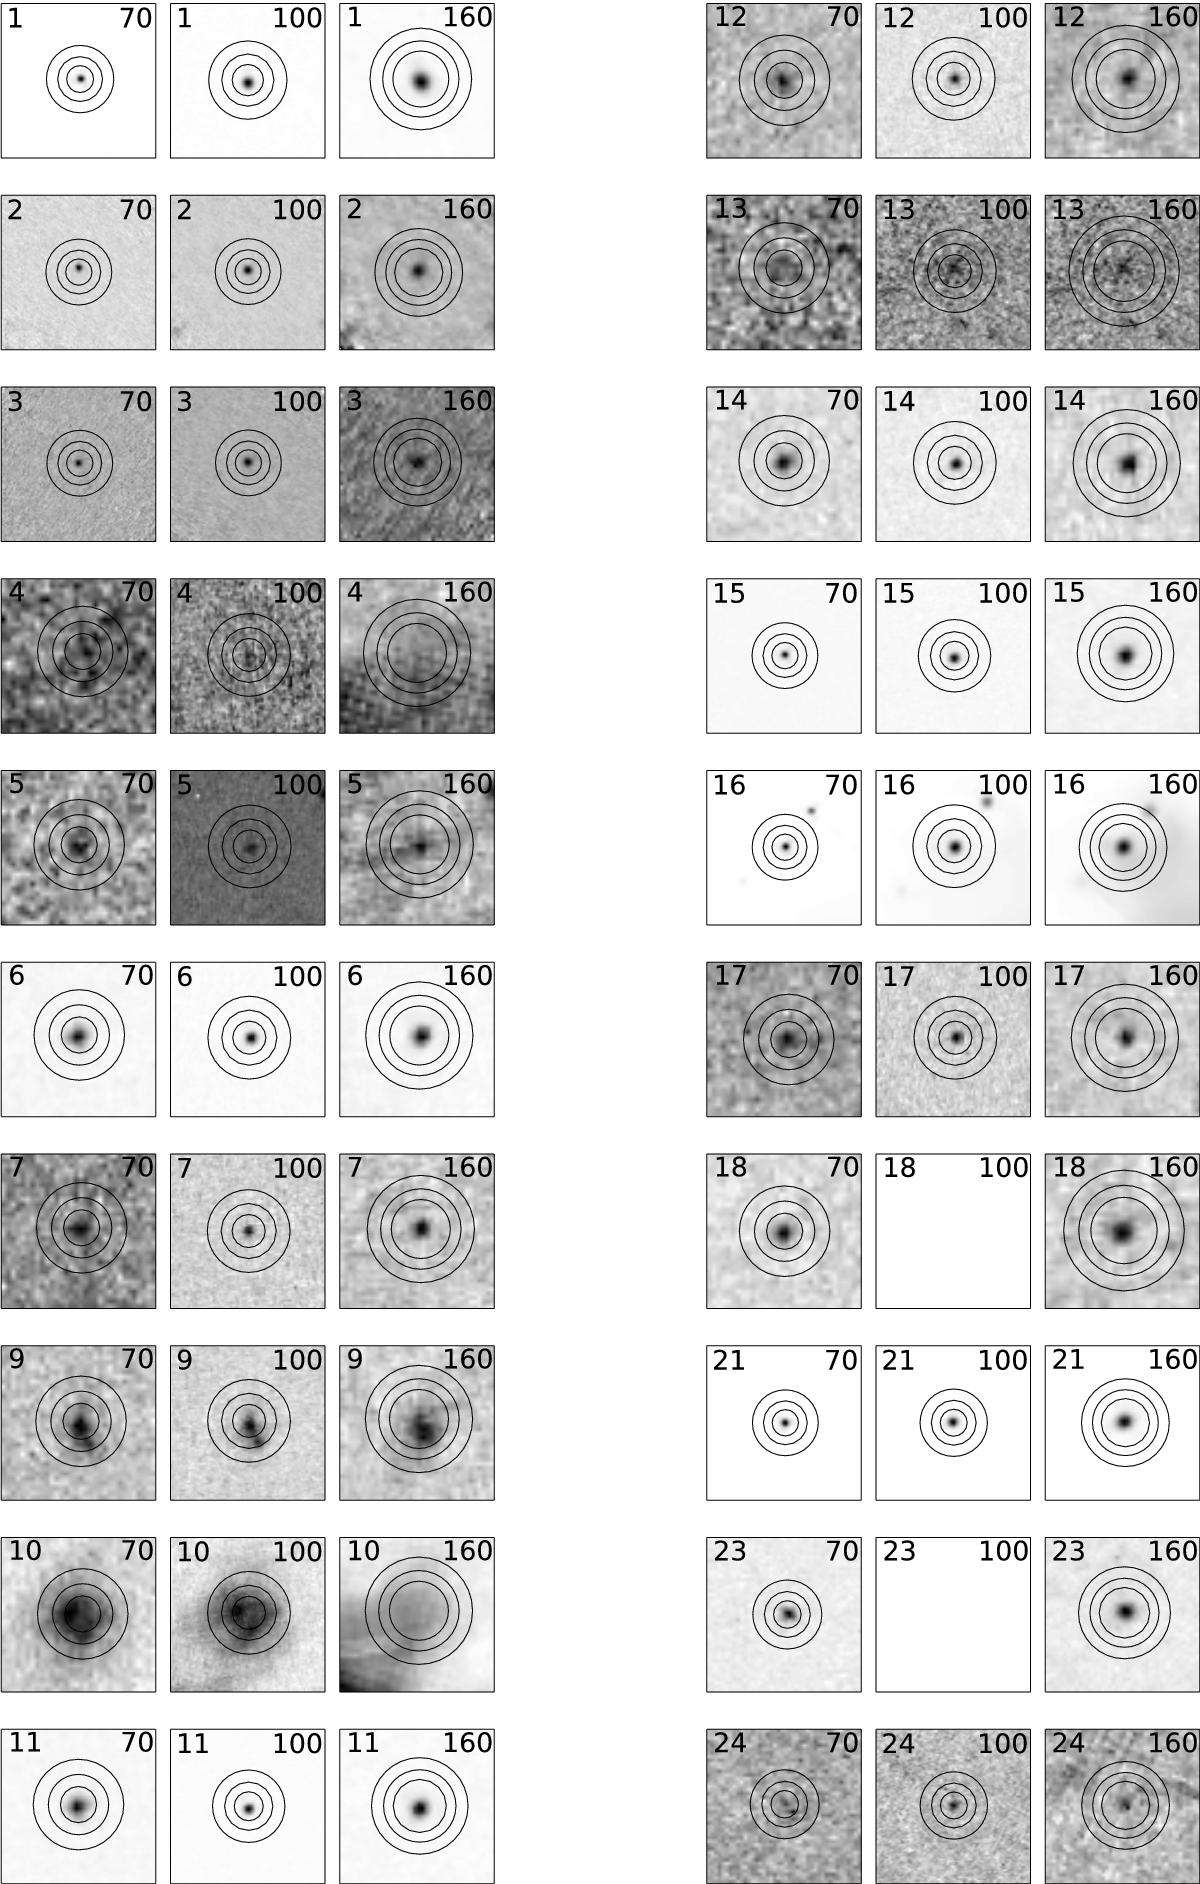
Cutouts of the Herschel-PACS maps. The number in the upper left corner corresponds to the ID, the number in the upper right corner corresponds to the wavelength of the image in μm. The inner circle indicates the aperture, and the outer two circles denotes the annulus in which in the noise was measured. The color scale has been scaled to the maximum in the image. When no 100 μm data is available (see text), the image is left blank.
Current usage metrics show cumulative count of Article Views (full-text article views including HTML views, PDF and ePub downloads, according to the available data) and Abstracts Views on Vision4Press platform.
Data correspond to usage on the plateform after 2015. The current usage metrics is available 48-96 hours after online publication and is updated daily on week days.
Initial download of the metrics may take a while.