Fig. 1
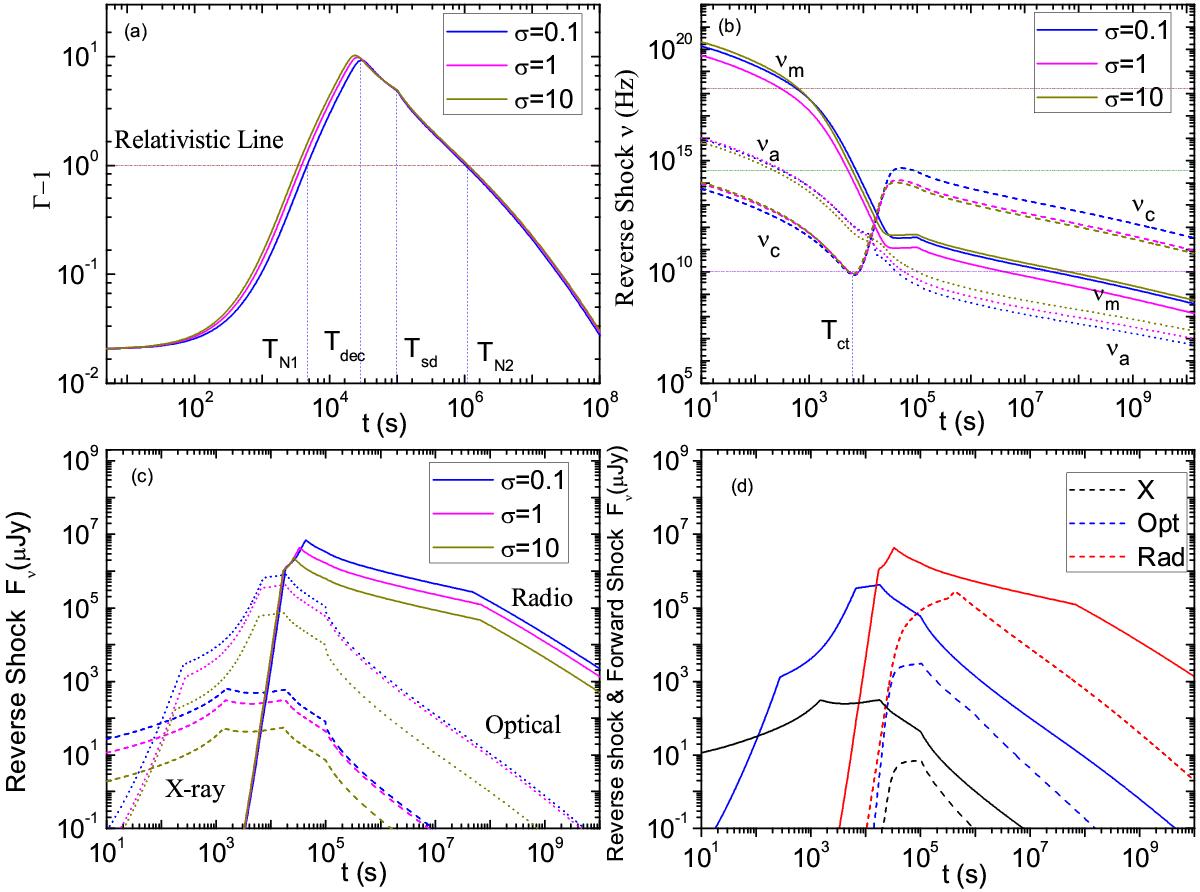
Calculation results for Case I: L0 = 1047 erg s-1, Mej = 10-4M⊙, ξ = 0.5, p = 2.3. a) The evolution of the Lorentz factor of the blast wave with different values of σ as labeled. b) The break frequencies νa (dotted), νm (solid), and νc (dashed) of the reverse shock emission. The three dashed to dotted lines mark the X-ray, optical (R), and radio (10 GHz) bands, respectively. c) Light curves of the reverse shock in X-ray, optical (R), and radio (10 GHz) bands. d) The solid lines represent the reverse shock light curves for σ = 0.1 and the dashed lines are light curves for the forward shock. In panels a)−c) the blue, magenta, and dark yellow lines represent σ = 0.1,1, and 10, respectively. In panel d), we can obtain that in Case I the reverse shock emission is stronger than the forward shock emission. It can be seen that the X-ray flux lasts for several tens of seconds, while the optical flux maintains a high level until the spin-down time Tsd, and then the radio emission becomes dominant.
Current usage metrics show cumulative count of Article Views (full-text article views including HTML views, PDF and ePub downloads, according to the available data) and Abstracts Views on Vision4Press platform.
Data correspond to usage on the plateform after 2015. The current usage metrics is available 48-96 hours after online publication and is updated daily on week days.
Initial download of the metrics may take a while.