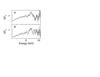
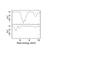
Fig. 7

Left: the 2.3–11 keV spectra taken from the two intervals, A 0–30 ks and B 30–60 ks, in the light curve. The spectra are plotted in 200-eV intervals with the best-fit model of the blueshifted ionized absorption computed by XSTAR (see text). Right: the χ2 curve as a function of energy, when scanning with a narrow Gaussian for absorption lines in the 7–10 keV range for the corresponding spectra.
Current usage metrics show cumulative count of Article Views (full-text article views including HTML views, PDF and ePub downloads, according to the available data) and Abstracts Views on Vision4Press platform.
Data correspond to usage on the plateform after 2015. The current usage metrics is available 48-96 hours after online publication and is updated daily on week days.
Initial download of the metrics may take a while.