Fig. 4
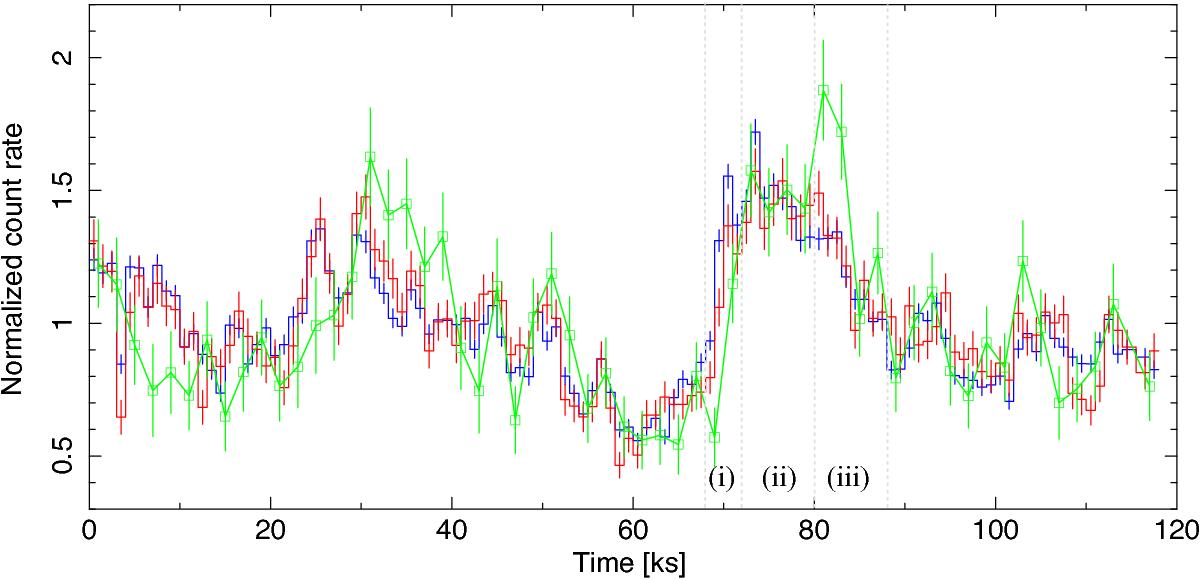
Light curves of the whole observation in 2–5 keV (blue), 5–8 keV (red), and 8–10 keV (green) bands, normalised to the mean count rate in the respective bands. The resolution of the light curve is 1 ks for the two lower energy bands and 2 ks for the 8–10 keV bands. The three intervals during the main flare, (i), (ii), and (iii), are indicated (see Sect. 3.3.1, Fig. 6).
Current usage metrics show cumulative count of Article Views (full-text article views including HTML views, PDF and ePub downloads, according to the available data) and Abstracts Views on Vision4Press platform.
Data correspond to usage on the plateform after 2015. The current usage metrics is available 48-96 hours after online publication and is updated daily on week days.
Initial download of the metrics may take a while.