Fig. 1
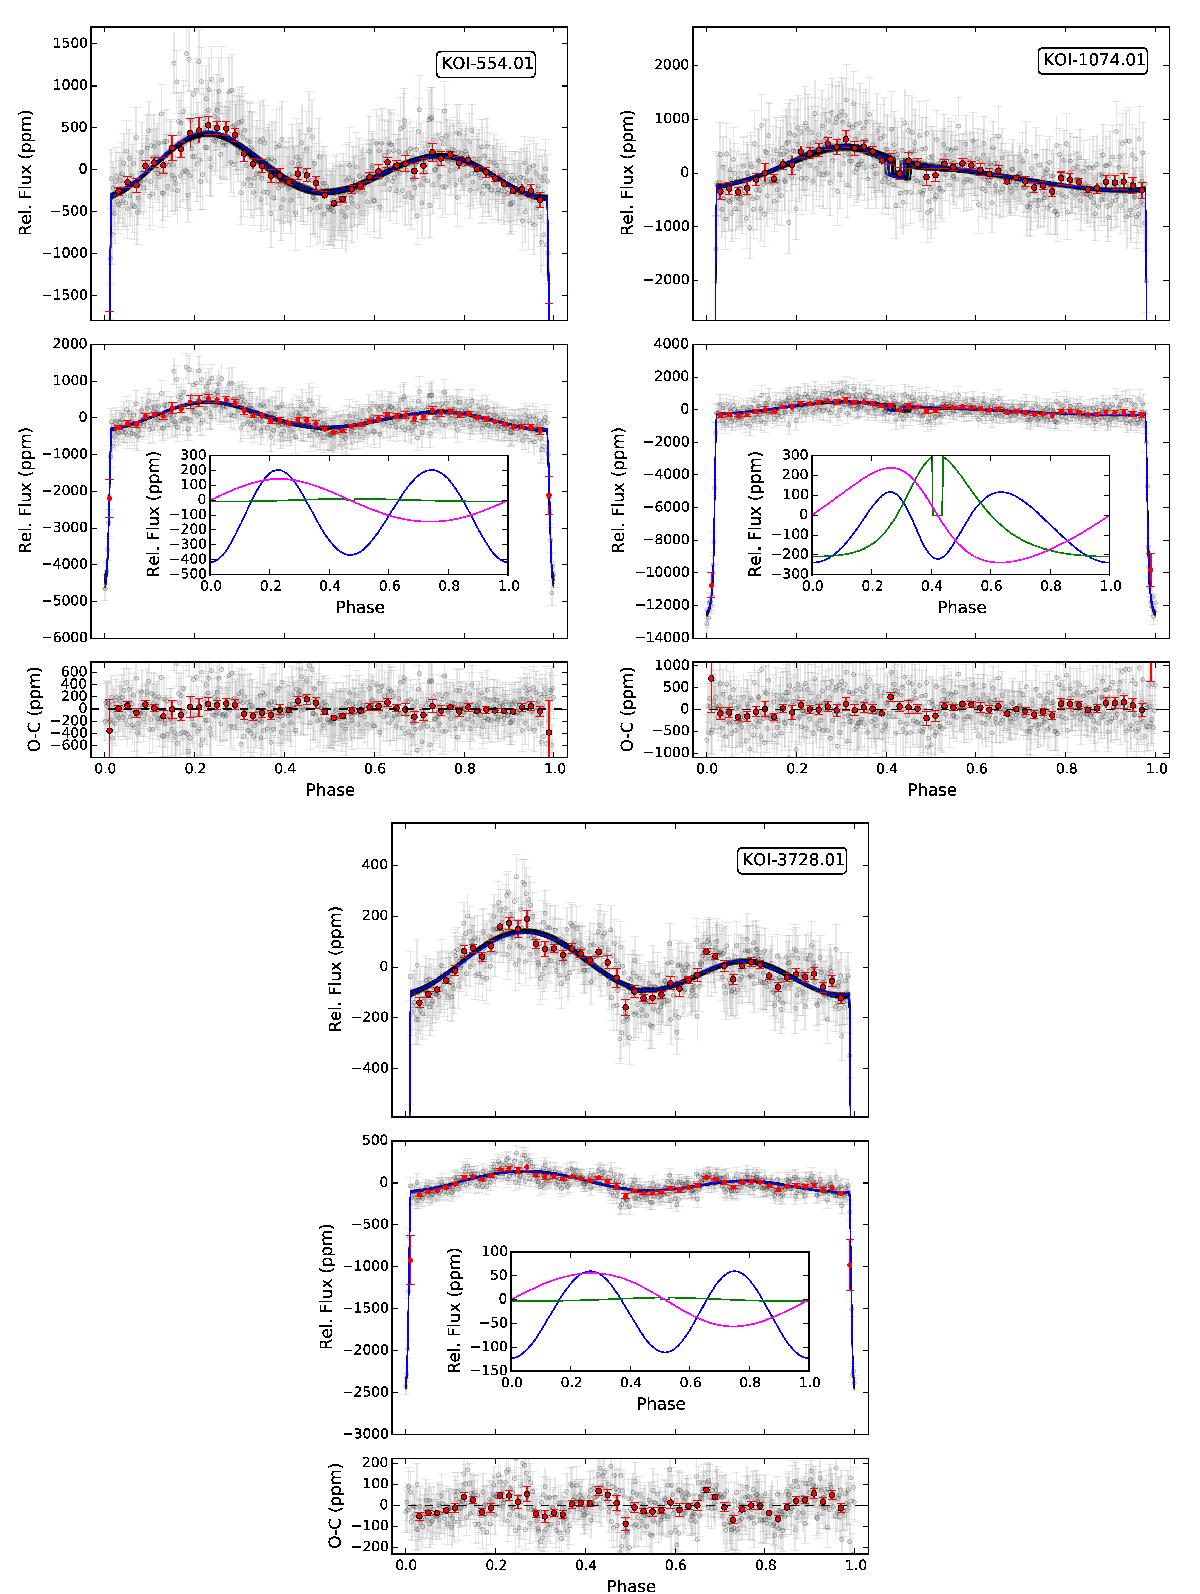
Fitting results for the three KOIs analyzed in this work. For each object, the top panel shows a close view of the out-of-eclipse time interval where the light curve modulations are detectable. The middle panel shows the complex light curve including the eclipse and an inset showing each contribution to the out-of-eclipse modulations. In the bottom panel, we show the residuals of the fit. Gray circles represent 500 bins along the orbit and red circles represent binnings of 100 datapoints. The best one hundred models are shown with black lines and the best model is shown with a blue line.
Current usage metrics show cumulative count of Article Views (full-text article views including HTML views, PDF and ePub downloads, according to the available data) and Abstracts Views on Vision4Press platform.
Data correspond to usage on the plateform after 2015. The current usage metrics is available 48-96 hours after online publication and is updated daily on week days.
Initial download of the metrics may take a while.