Fig. 9
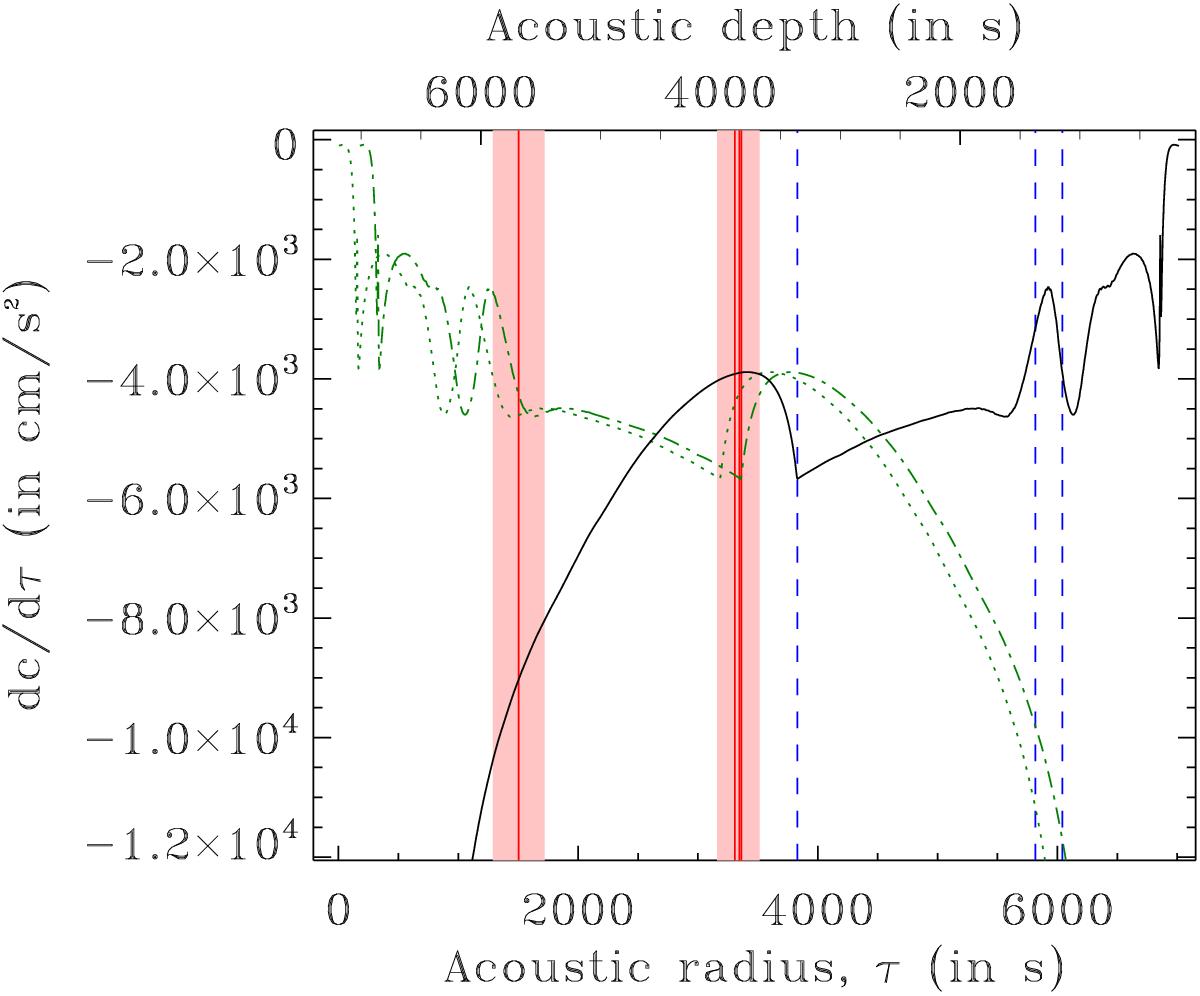
Comparison between glitch-based solutions for the acoustic radius of the base of the convection zone in Felix (solid vertical red lines and shaded pink area for the error bars), and the dc/ dτ profile (solid black curve). The true solution, the He II ionisation zone, and the peak in the Γ1 profile, located between the He I and He II ionisation zones, are indicated by the vertical dashed blue lines at 3830 s, 5816 s, and 6041 s, respectively. The dotted and the dot-dashed green curves show dc/ dτ as a function of acoustic depth. Given the uncertainties on the determination of the total acoustic radius, the dotted curve uses τTot. whereas the dot-dashed curve uses 1/2Δν (see Table 6). The upper x-axis also uses 1/2Δν as the total acoustic radius.
Current usage metrics show cumulative count of Article Views (full-text article views including HTML views, PDF and ePub downloads, according to the available data) and Abstracts Views on Vision4Press platform.
Data correspond to usage on the plateform after 2015. The current usage metrics is available 48-96 hours after online publication and is updated daily on week days.
Initial download of the metrics may take a while.