Free Access
Fig. 11
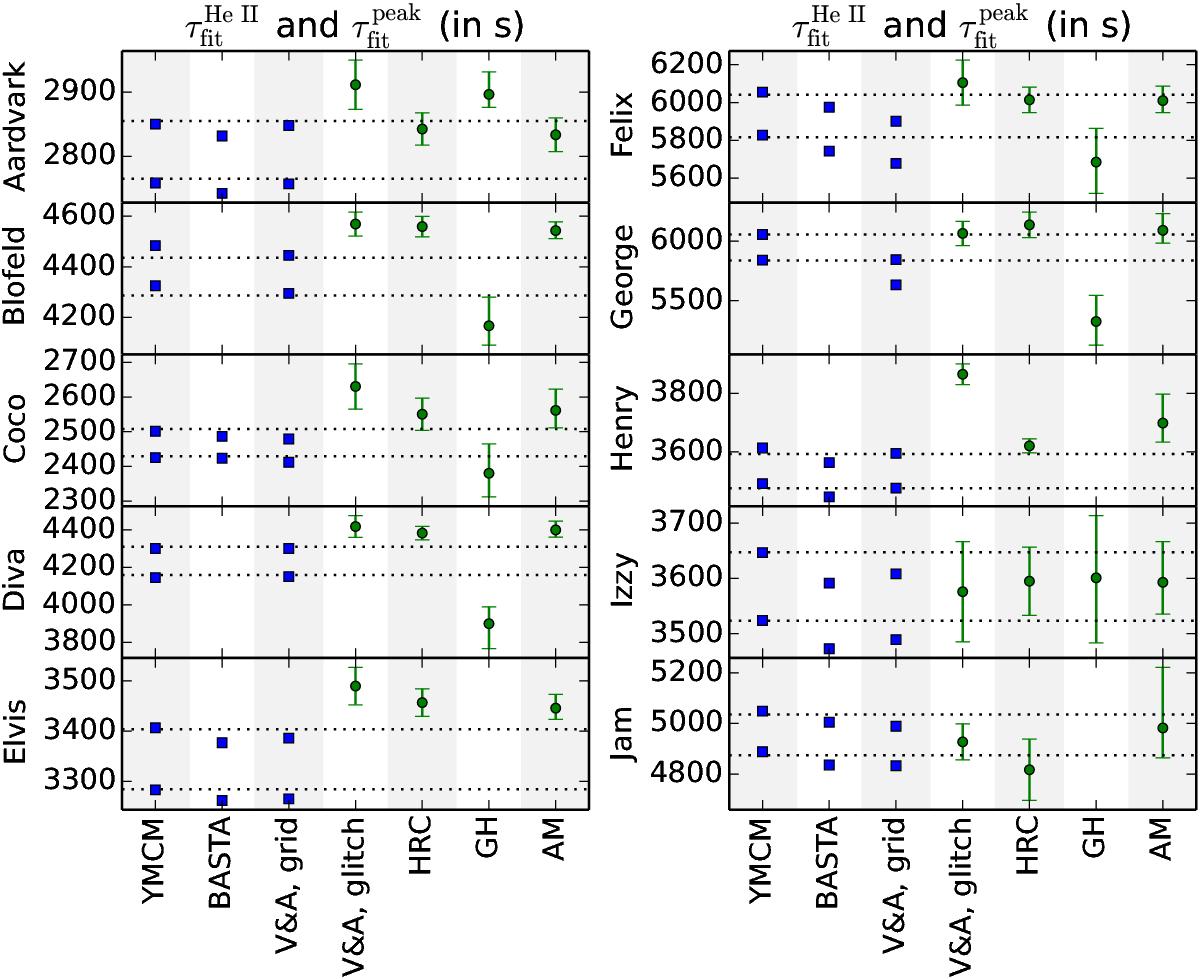
Fitted results for τHe II and τpeak (in s). The two horizontal dotted lines correspond to the solutions (τHe II is always smaller than τpeak), and the various symbols correspond to the results from the different hounds. The type of symbol corresponds to the type of method (forward modelling or glitch analysis).
Current usage metrics show cumulative count of Article Views (full-text article views including HTML views, PDF and ePub downloads, according to the available data) and Abstracts Views on Vision4Press platform.
Data correspond to usage on the plateform after 2015. The current usage metrics is available 48-96 hours after online publication and is updated daily on week days.
Initial download of the metrics may take a while.