Fig. A.1
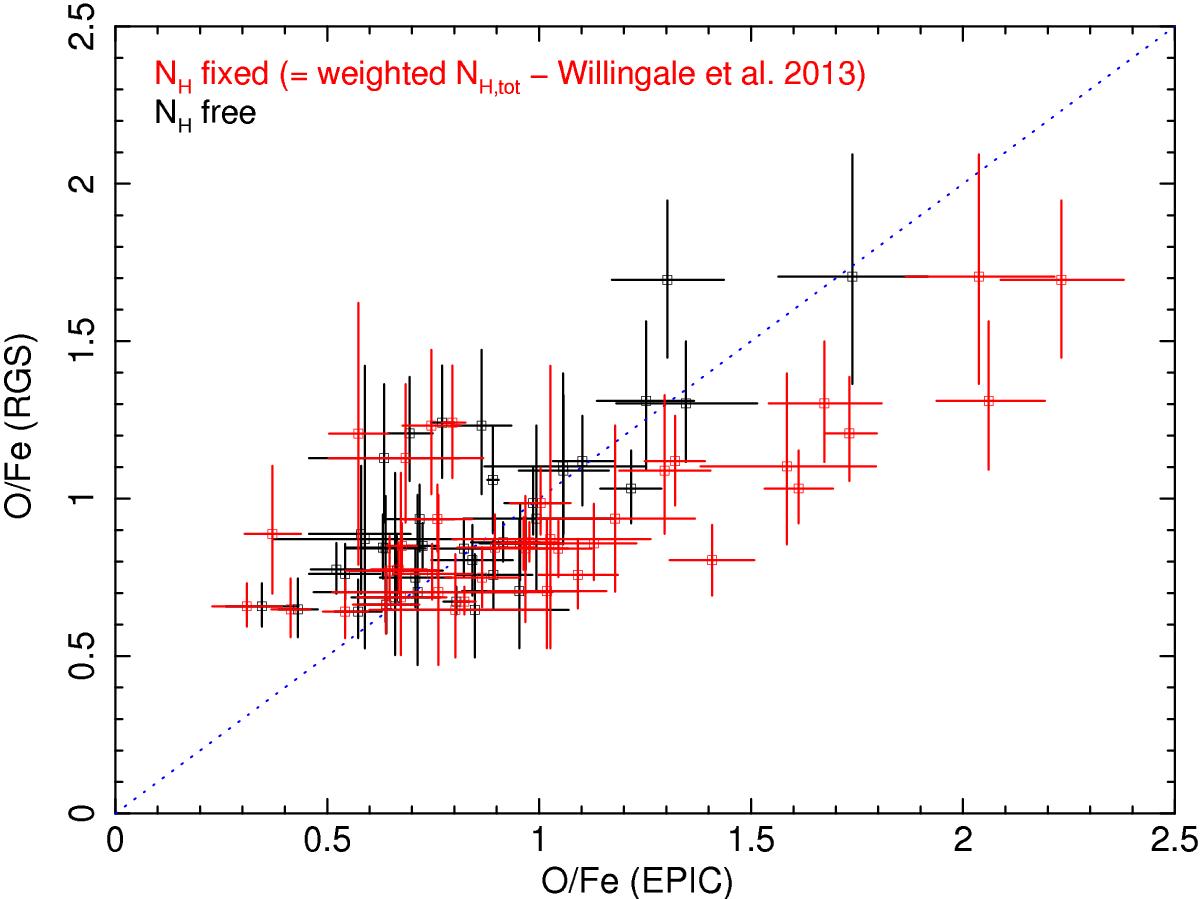
Comparison between the EPIC and RGS measurements of the O/Fe abundance ratio in most objects of our (0.05 + 0.2)r500 sample. The blue dotted line shows the one-to-one EPIC-RGS correspondence. In our fits we alternatively fix the NH to the weighted neutral+molecular values calculated from Willingale et al. (2013), and leave it free within the ranges given by Eq. (A.1). The two approaches are shown in red and black, respectively.
Current usage metrics show cumulative count of Article Views (full-text article views including HTML views, PDF and ePub downloads, according to the available data) and Abstracts Views on Vision4Press platform.
Data correspond to usage on the plateform after 2015. The current usage metrics is available 48-96 hours after online publication and is updated daily on week days.
Initial download of the metrics may take a while.