Fig. 6
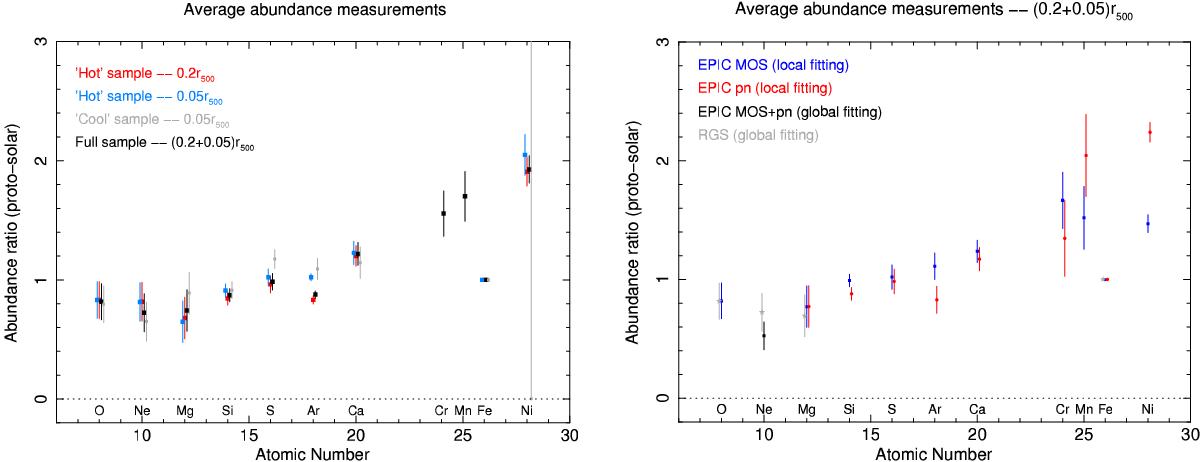
Left: average abundance ratios considering different (sub-)samples and/or different EPIC extraction regions. The O/Fe and Ne/Fe ratios are measured using RGS (cross-dispersion width of 0.8′). For these two ratios there is thus no distinction between the two hot samples or between the two full samples. The error bars incorporate the statistical errors (σstat) and the intrinsic scatters (σint + 1σ). Right: average abundance ratios estimated from the (0.05 + 0.2)r500 sample, measured independently by different combinations of instruments. The error bars incorporate the statistical errors (σstat), the intrinsic scatters (σint + 1σ), and the uncertainties derived from the different EPIC extraction regions and/or subsamples (σregion, see left panel).
Current usage metrics show cumulative count of Article Views (full-text article views including HTML views, PDF and ePub downloads, according to the available data) and Abstracts Views on Vision4Press platform.
Data correspond to usage on the plateform after 2015. The current usage metrics is available 48-96 hours after online publication and is updated daily on week days.
Initial download of the metrics may take a while.