Free Access
Fig. 5
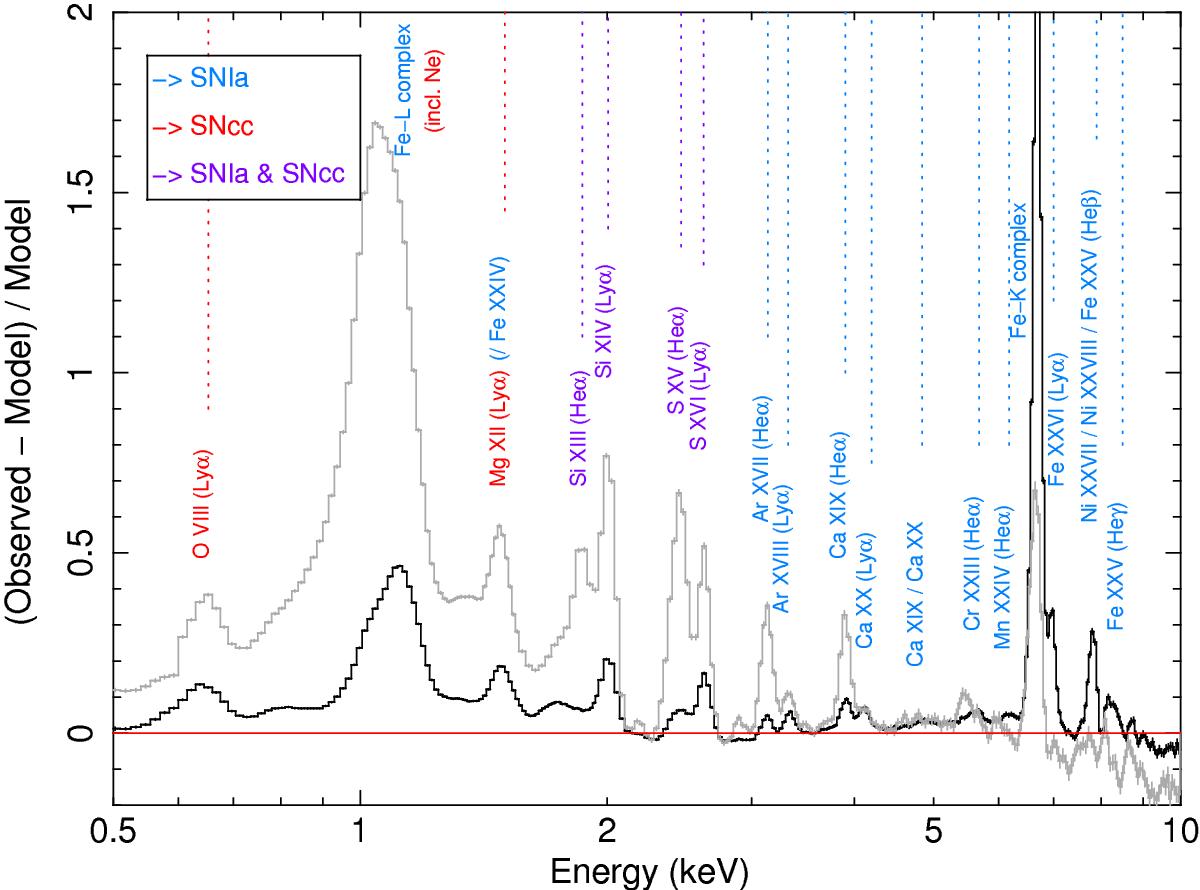
Same as Fig. 4 (bottom), this time comparing the 0.05r500 cool (grey curve) and the 0.2r500 hot (black curve) subsamples. The height of the peak of the Fe-K complex in the 0.2r500 hot sample is ~2.23.
Current usage metrics show cumulative count of Article Views (full-text article views including HTML views, PDF and ePub downloads, according to the available data) and Abstracts Views on Vision4Press platform.
Data correspond to usage on the plateform after 2015. The current usage metrics is available 48-96 hours after online publication and is updated daily on week days.
Initial download of the metrics may take a while.