Fig. C.1
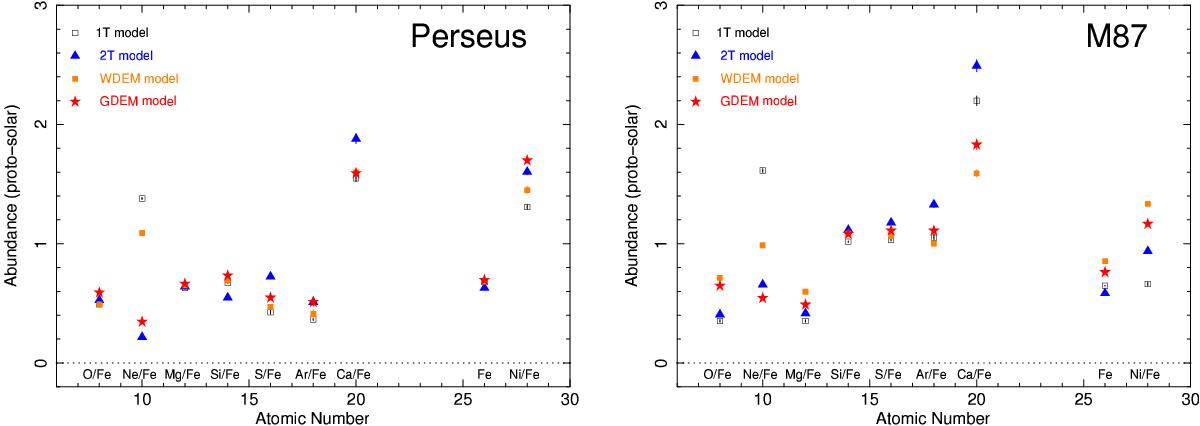
EPIC abundance measurements in the two best-quality observations of our sample, based on global fittings (see also Table C.1). Four thermal models are successively considered: 1T (black empty squares), 2T (blue filled squares), wdem (orange filled squares), and gdem (red filled squares). The Fe abundance is given in absolute values, while the other abundances are given relative to Fe. Left: perseus (0.2r500). Right: M 87 (0.05r500).
Current usage metrics show cumulative count of Article Views (full-text article views including HTML views, PDF and ePub downloads, according to the available data) and Abstracts Views on Vision4Press platform.
Data correspond to usage on the plateform after 2015. The current usage metrics is available 48-96 hours after online publication and is updated daily on week days.
Initial download of the metrics may take a while.