Fig. 4
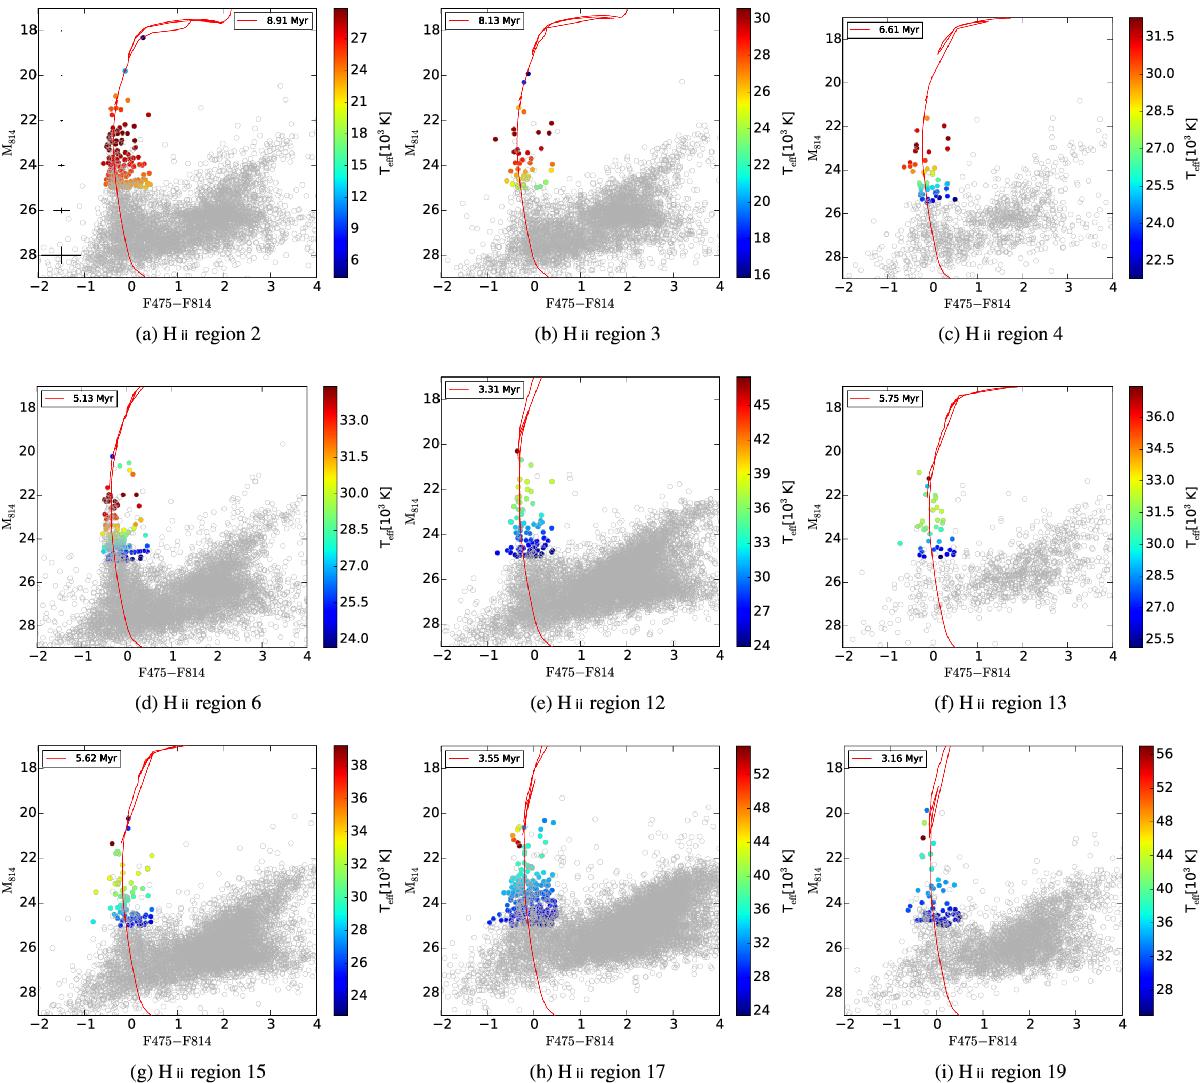
CMDs of the shortlisted H ii regions with isochrones that fit the data best. The age of the isochrone is indicated in upper left corner of each panel. The stars for which we fit the parameters using TA-DA are color-coded by their fitted temperature. In the upper left panel, the black crosses indicate the typical photometric errors in color and magnitude as a function of the F814W magnitude.
Current usage metrics show cumulative count of Article Views (full-text article views including HTML views, PDF and ePub downloads, according to the available data) and Abstracts Views on Vision4Press platform.
Data correspond to usage on the plateform after 2015. The current usage metrics is available 48-96 hours after online publication and is updated daily on week days.
Initial download of the metrics may take a while.