Fig. 9
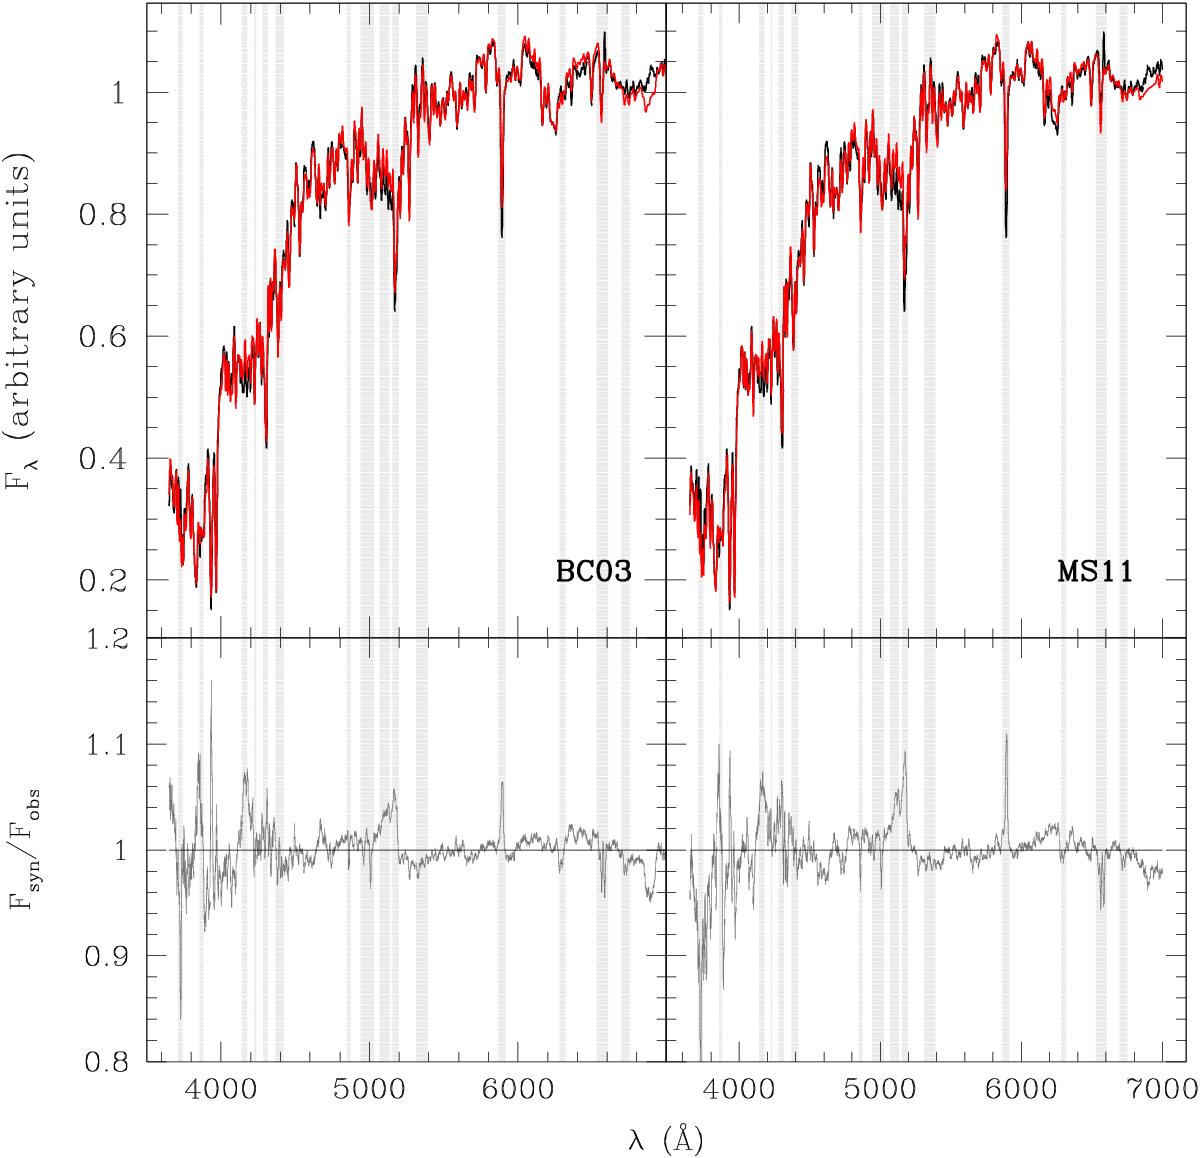
Typical output of the full-spectrum fitting procedure using BC03 (left) and MS11 (right) spectral synthesis models. In particular, we show the case of the median stacked spectrum derived for 11 < log (M/M⊙) < 11.25 and z ~ 0.05. In the top panel the black curve is the observed spectrum, the red curve is the best fit model and grey shaded regions are the masked spectral regions (see Table 1). The bottom panel shows the ratio of the best fit model spectrum to the observed flux.
Current usage metrics show cumulative count of Article Views (full-text article views including HTML views, PDF and ePub downloads, according to the available data) and Abstracts Views on Vision4Press platform.
Data correspond to usage on the plateform after 2015. The current usage metrics is available 48-96 hours after online publication and is updated daily on week days.
Initial download of the metrics may take a while.