Fig. 8
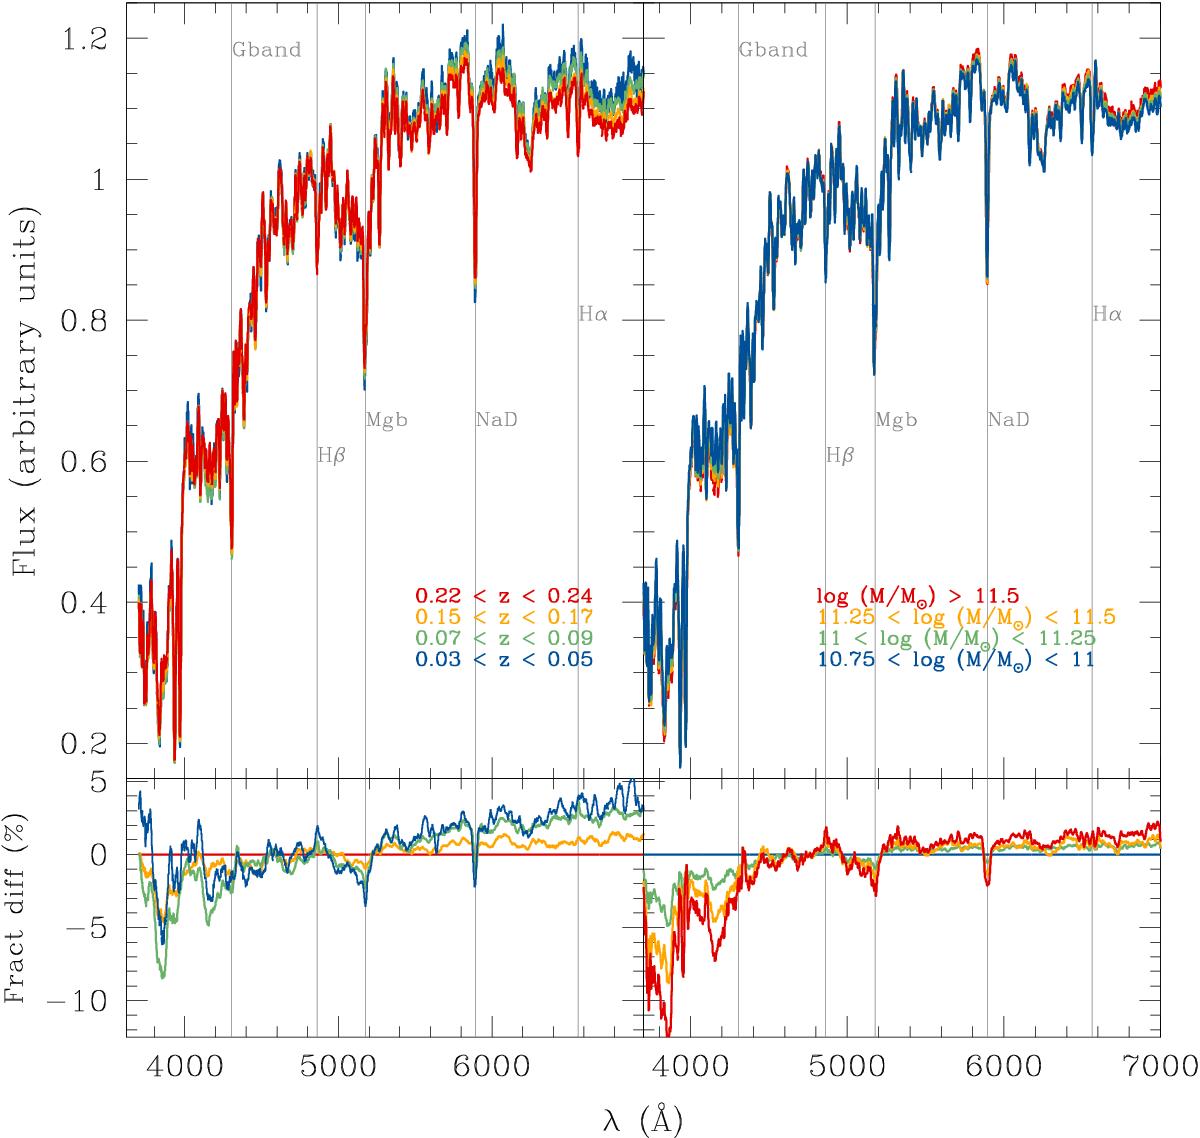
SDSS median stacked spectra for the sample of massive and passive ETGs. Left and right upper panels show, respectively, median stacked spectra with a fixed redshift (0.15 ≲ z ≲ 0.19) and different masses (with mass increasing from blue to red) and with a fixed mass (11.25 < log (M/M⊙) < 11.5) and four different redshifts (0.04, 0.08, 0.16, 0.23) (with redshift increasing from blue to red). Lower panels illustrate the fractional differences (defined as (fi−fREF/fREF) × 100, where fi is the flux of the ith spectrum and fREF is the reference flux) among the stacked spectra as a function of wavelength. In particular, to show the redshift and the mass dependence we used as reference, respectively, the median stacked spectrum obtained for 11.25 < log (M/M⊙) < 11.5 and 0.07 < z < 0.09, and the one corresponding to 10.75 < log (M/M⊙) < 11 and 0.15 < z < 0.17. Vertical grey lines mark some of the best-known absorption lines.
Current usage metrics show cumulative count of Article Views (full-text article views including HTML views, PDF and ePub downloads, according to the available data) and Abstracts Views on Vision4Press platform.
Data correspond to usage on the plateform after 2015. The current usage metrics is available 48-96 hours after online publication and is updated daily on week days.
Initial download of the metrics may take a while.