Fig. 25
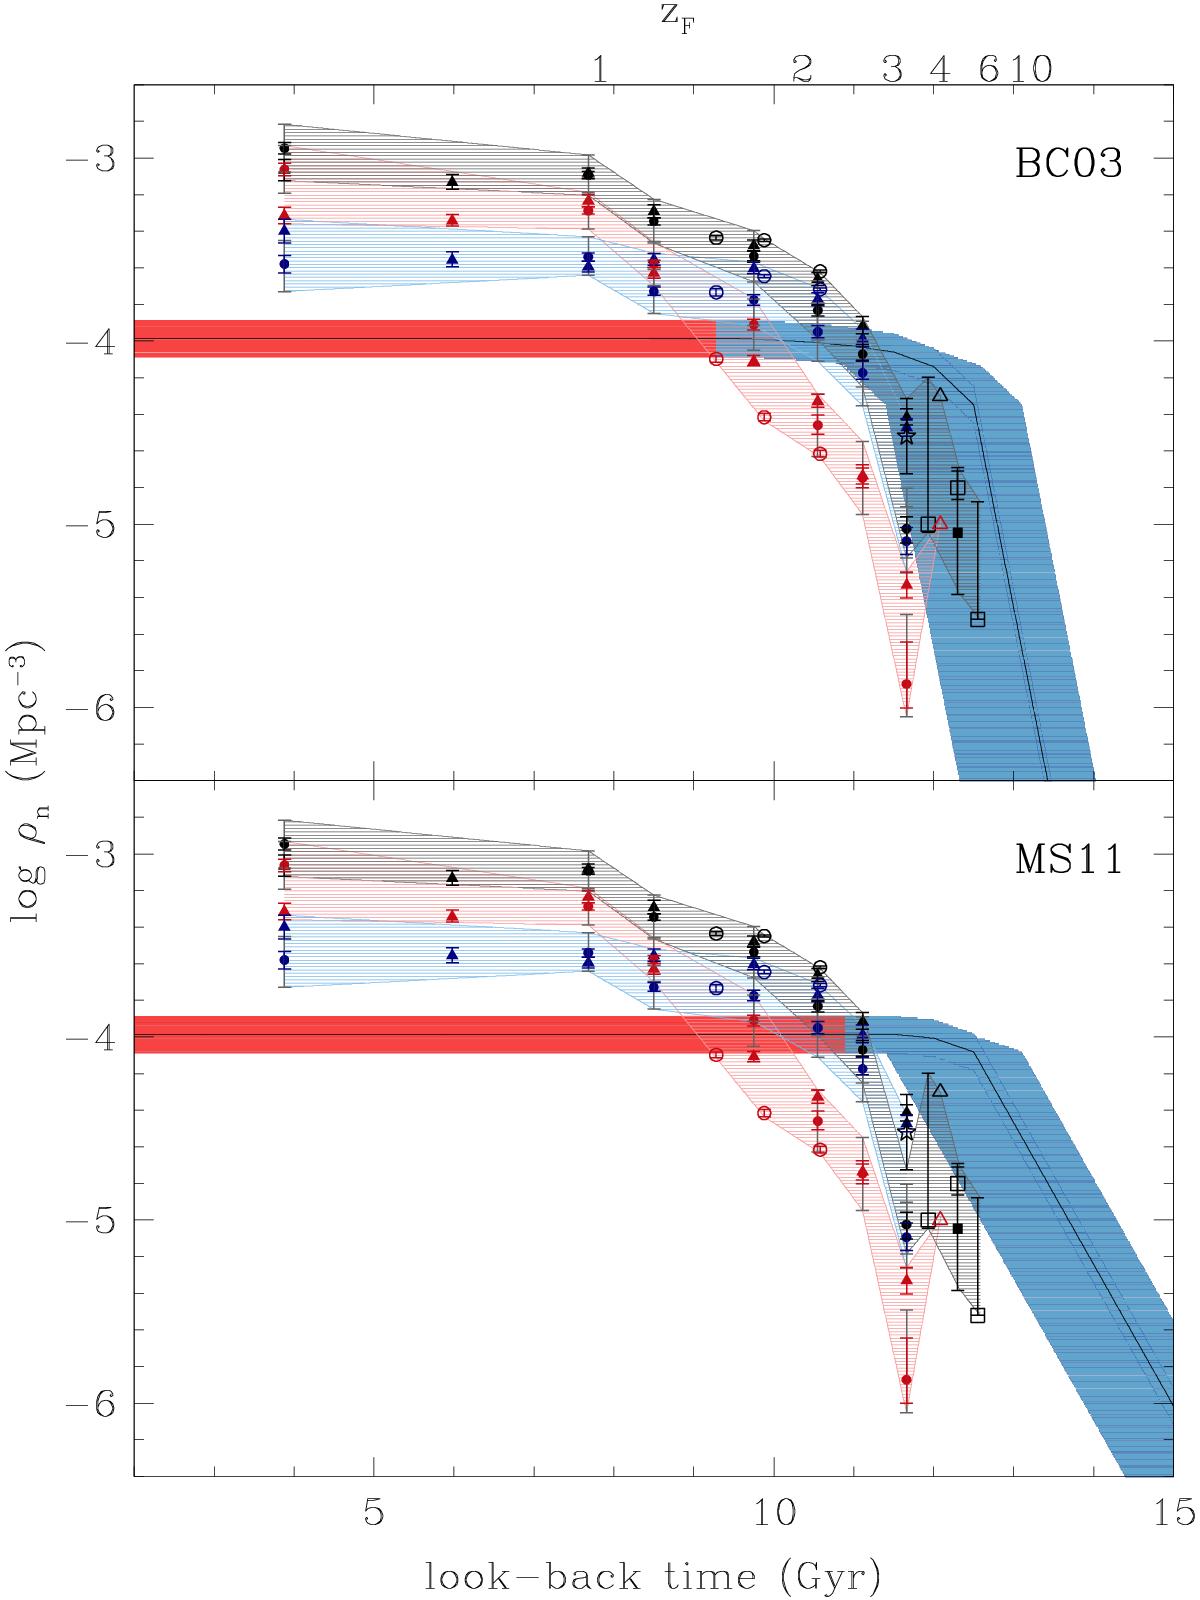
Number density above log (M/M⊙) = 10.75. The central coloured bands are the ρn of the ETG progenitors as a function of the look-back time in the case of BC03 (upper panel) and MS11 (lower panel) models, derived from the SFHs of the analyzed ETGs, together with its uncertainty (±0.1 dex) and the uncertainty on the look-back time (i.e. ![]() Gyr, considering the small ~0.5 Gyr systematic introduced by median stacked spectra, see Sect. 5). The red and the blue parts cover, respectively, the redshift interval within which ETGs are completely quiescent or star-forming. At each cosmic epoch, the literature results are illustrated with red, blue and black symbols, which refer to the ρn of the quiescent, the star forming and the global galaxy population (i.e. Star-forming+quiescent galaxies), respectively (all above the same mass threshold). In more detail, closed triangles and circles are the Ilbert et al. (2013) and the Muzzin et al. (2013)ρn, respectively; open triangles and circles are the Mancini et al. (2009) and the Domínguez Sánchez et al. (2011) values, respectively; open squares and stars are the Grazian et al. (2015) and the Caputi et al. (2015) values, respectively. The shaded coloured regions emphasize the uncertainties in the literature number densities (at each cosmic time, we consider the outermost envelope which includes all the literature estimates, taking into account their uncertainties). It is important to note that the literature ρn and their associated errors are derived by integrating the GSMF inferred through the 1 /Vmax method, and by computing the quadrature sum of its errors. The Muzzin et al. (2013) error estimates (obtained from the best fit Schechter functions) are also shown in grey.
Gyr, considering the small ~0.5 Gyr systematic introduced by median stacked spectra, see Sect. 5). The red and the blue parts cover, respectively, the redshift interval within which ETGs are completely quiescent or star-forming. At each cosmic epoch, the literature results are illustrated with red, blue and black symbols, which refer to the ρn of the quiescent, the star forming and the global galaxy population (i.e. Star-forming+quiescent galaxies), respectively (all above the same mass threshold). In more detail, closed triangles and circles are the Ilbert et al. (2013) and the Muzzin et al. (2013)ρn, respectively; open triangles and circles are the Mancini et al. (2009) and the Domínguez Sánchez et al. (2011) values, respectively; open squares and stars are the Grazian et al. (2015) and the Caputi et al. (2015) values, respectively. The shaded coloured regions emphasize the uncertainties in the literature number densities (at each cosmic time, we consider the outermost envelope which includes all the literature estimates, taking into account their uncertainties). It is important to note that the literature ρn and their associated errors are derived by integrating the GSMF inferred through the 1 /Vmax method, and by computing the quadrature sum of its errors. The Muzzin et al. (2013) error estimates (obtained from the best fit Schechter functions) are also shown in grey.
Current usage metrics show cumulative count of Article Views (full-text article views including HTML views, PDF and ePub downloads, according to the available data) and Abstracts Views on Vision4Press platform.
Data correspond to usage on the plateform after 2015. The current usage metrics is available 48-96 hours after online publication and is updated daily on week days.
Initial download of the metrics may take a while.