Fig. 22
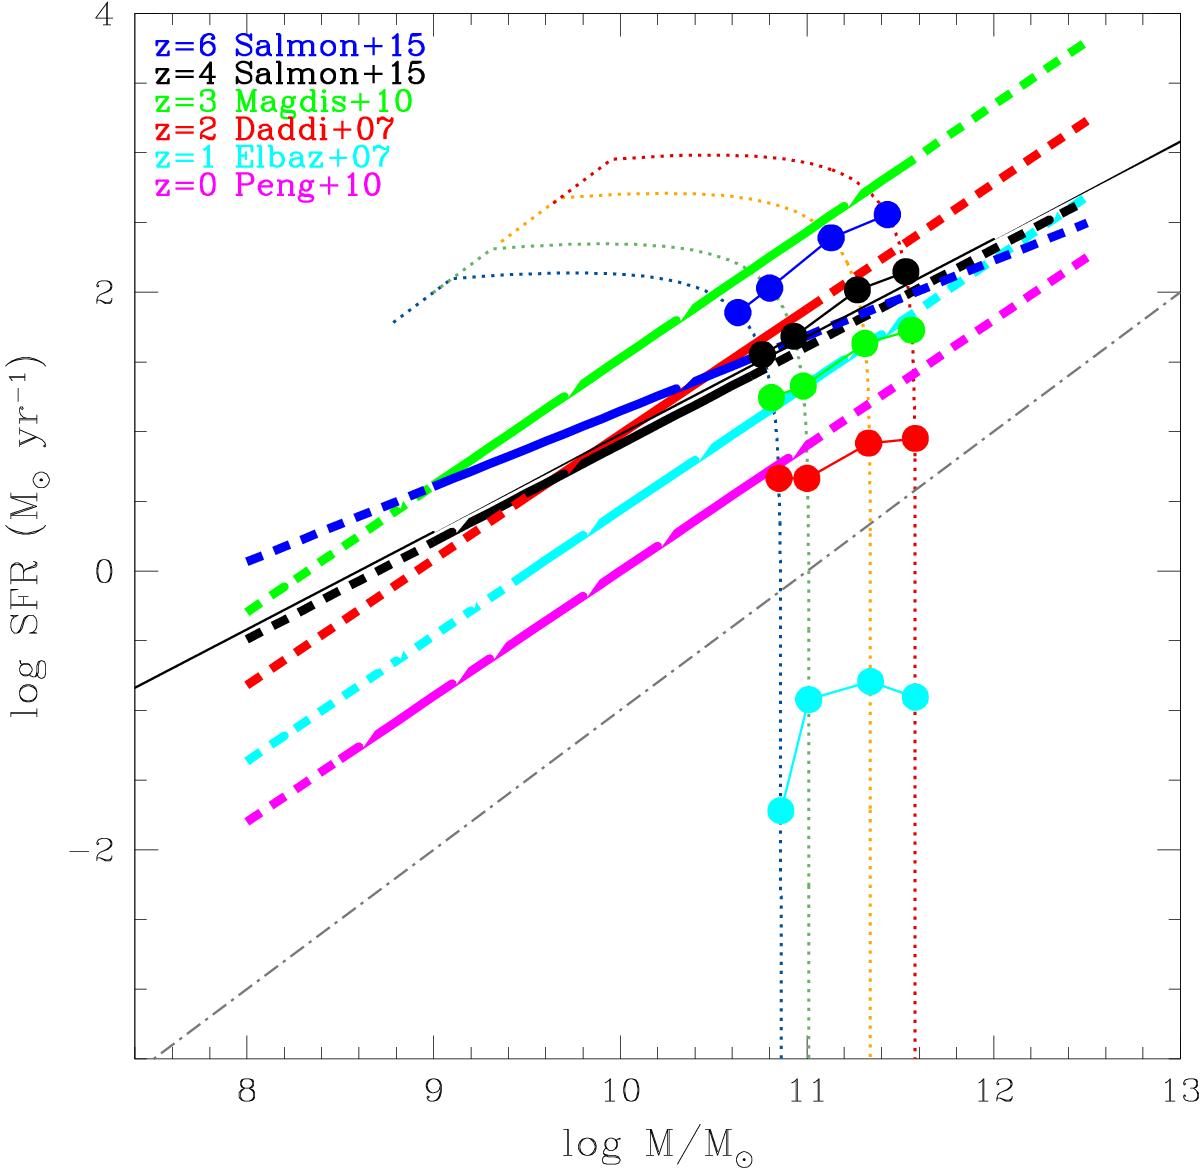
Evolving SFR – mass curves (in the case of BC03 models and for the Expdelc parametric form). The four dotted curves are the evolving SFR – mass relations for the four mass bins of our sample (deduced from the SFHs of Fig. 16) as a function of cosmic time (from left to right), colour coded as in Fig. 16. Blue, black, green, red, cyan and magenta lines are the SFR – mass relations deduced by different authors at various redshifts (as indicated in the top left of the figure), within their observed mass ranges (solid lines). Filled circles are the SFR for the four mass bins at various z, corresponding to the ones reported in the top left of the figure (we note that, at z ~ 0, we derive log (SFR) < −3, thus the values at this redshift are not included in the plot). The grey dashed-dotted line represents the level of SFR at which the galaxies can be considered completely quiescent.
Current usage metrics show cumulative count of Article Views (full-text article views including HTML views, PDF and ePub downloads, according to the available data) and Abstracts Views on Vision4Press platform.
Data correspond to usage on the plateform after 2015. The current usage metrics is available 48-96 hours after online publication and is updated daily on week days.
Initial download of the metrics may take a while.