Fig. 16
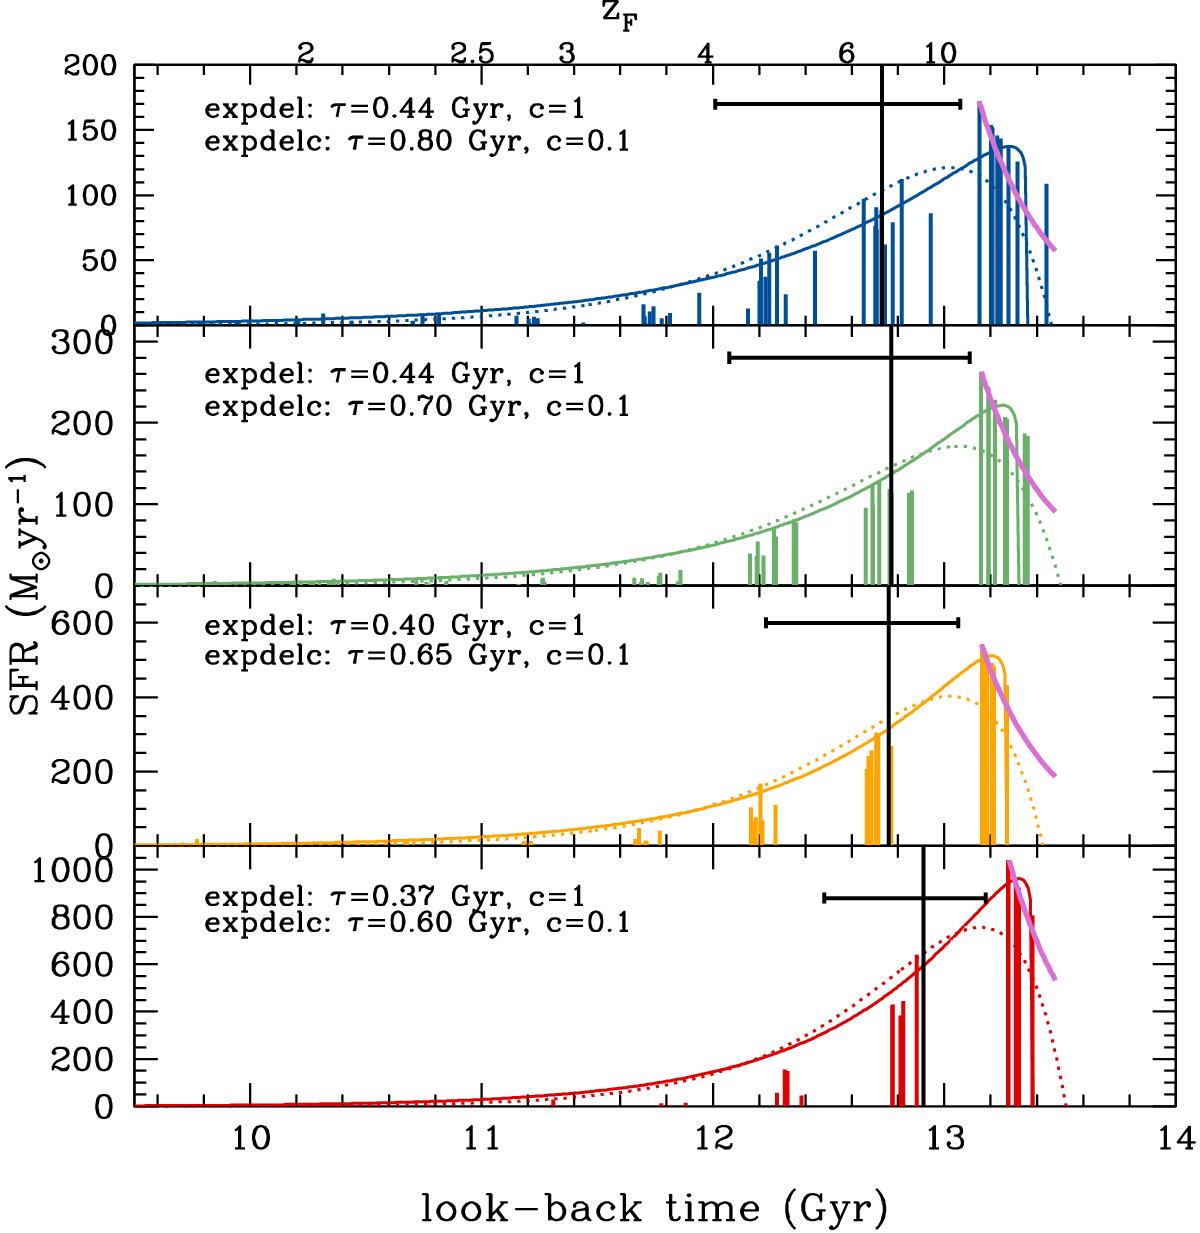
SFH for the four mass bins of our sample, with mass increasing from top to bottom (in the case of BC03 models). Colored vertical lines are the SFR (M⊙ yr-1) derived from the mj provided by the spectral fitting (colours are coded as in Fig. 10). In each mass bin, black vertical and horizontal lines are defined as in Fig. 13. In each panel, we show the two best fit models deriving from the assumption of an Expdel (dotted curves) or an Expdelc (solid curves) parametric function to describe the derived SFHs. The best fit parameters are also reported. Pink curves are the inverted-τ models with τ = 0.3 Gyr described in the text, extended up to 13.48 Gyr (which corresponds to the age of the Universe in the assumed cosmology).
Current usage metrics show cumulative count of Article Views (full-text article views including HTML views, PDF and ePub downloads, according to the available data) and Abstracts Views on Vision4Press platform.
Data correspond to usage on the plateform after 2015. The current usage metrics is available 48-96 hours after online publication and is updated daily on week days.
Initial download of the metrics may take a while.