Fig. 13
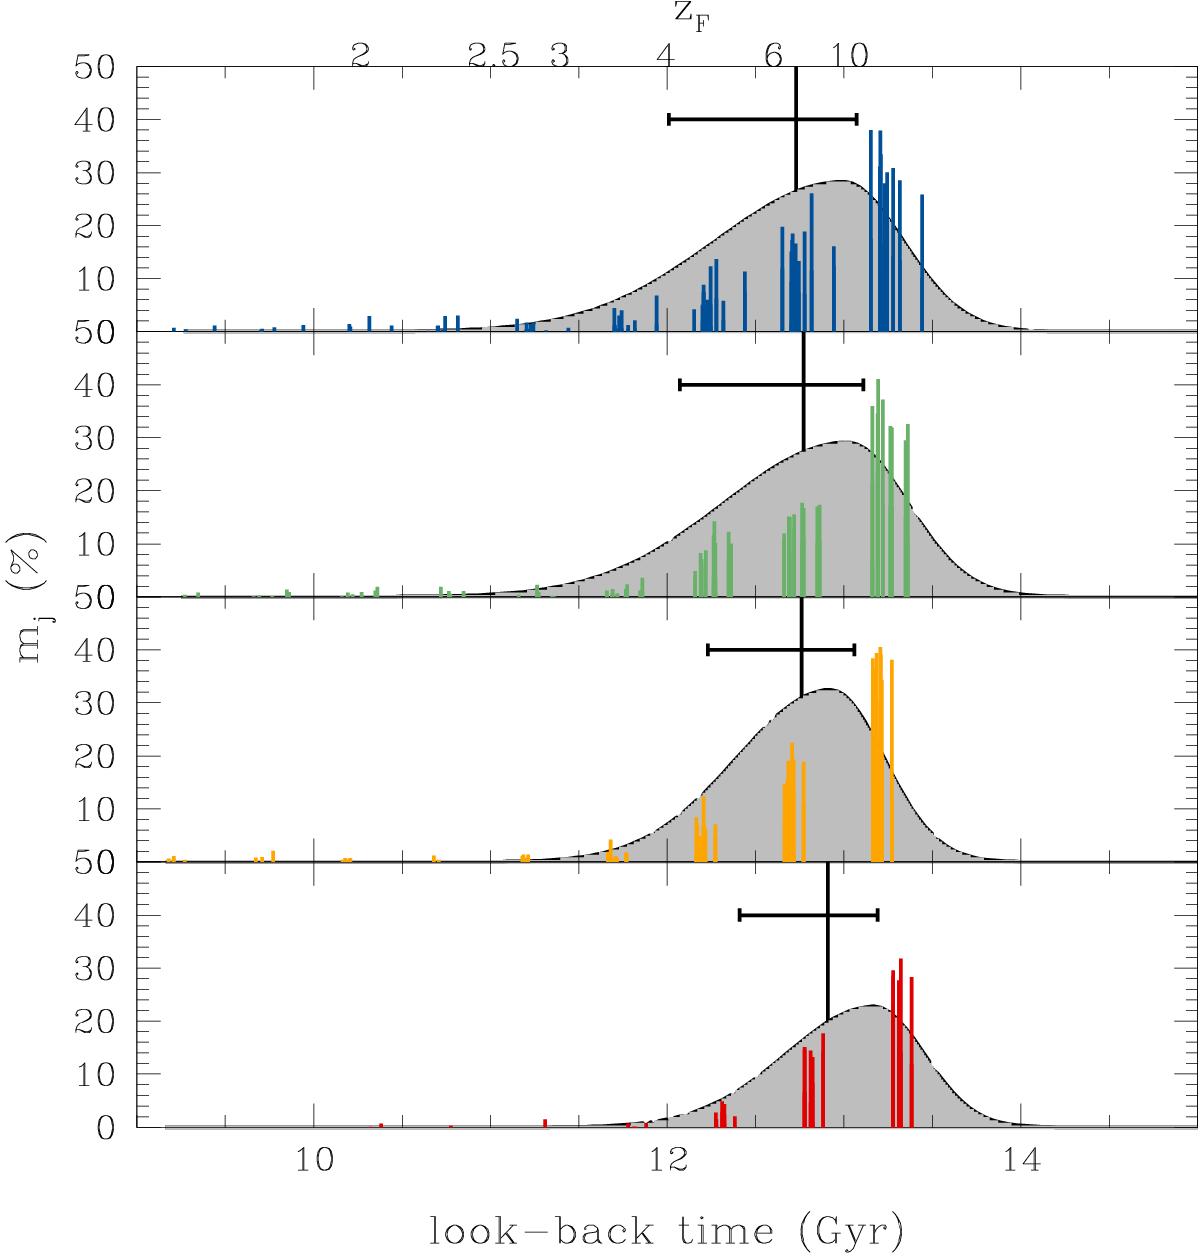
Mass fractions mj as a function of look-back time for the four mass bins, with mass increasing from top to bottom (in the case of BC03 models). Colored vertical lines (colour-coded as in Fig. 10) are the mj obtained from the full-spectrum fitting for each mass bin, put in phase according to their P50. In each mass bin, black vertical lines mark the P50 of the distribution, obtained from data as an average of the P50 of all the redshift bins, while black horizontal lines are the median dispersions [P50 – P16] and [P84 – P50]. The corresponding asymmetric Gaussians (grey) are overplotted on the mj distributions. On the top of the figure, the zF corresponding to each agef is indicated.
Current usage metrics show cumulative count of Article Views (full-text article views including HTML views, PDF and ePub downloads, according to the available data) and Abstracts Views on Vision4Press platform.
Data correspond to usage on the plateform after 2015. The current usage metrics is available 48-96 hours after online publication and is updated daily on week days.
Initial download of the metrics may take a while.