Fig. 12
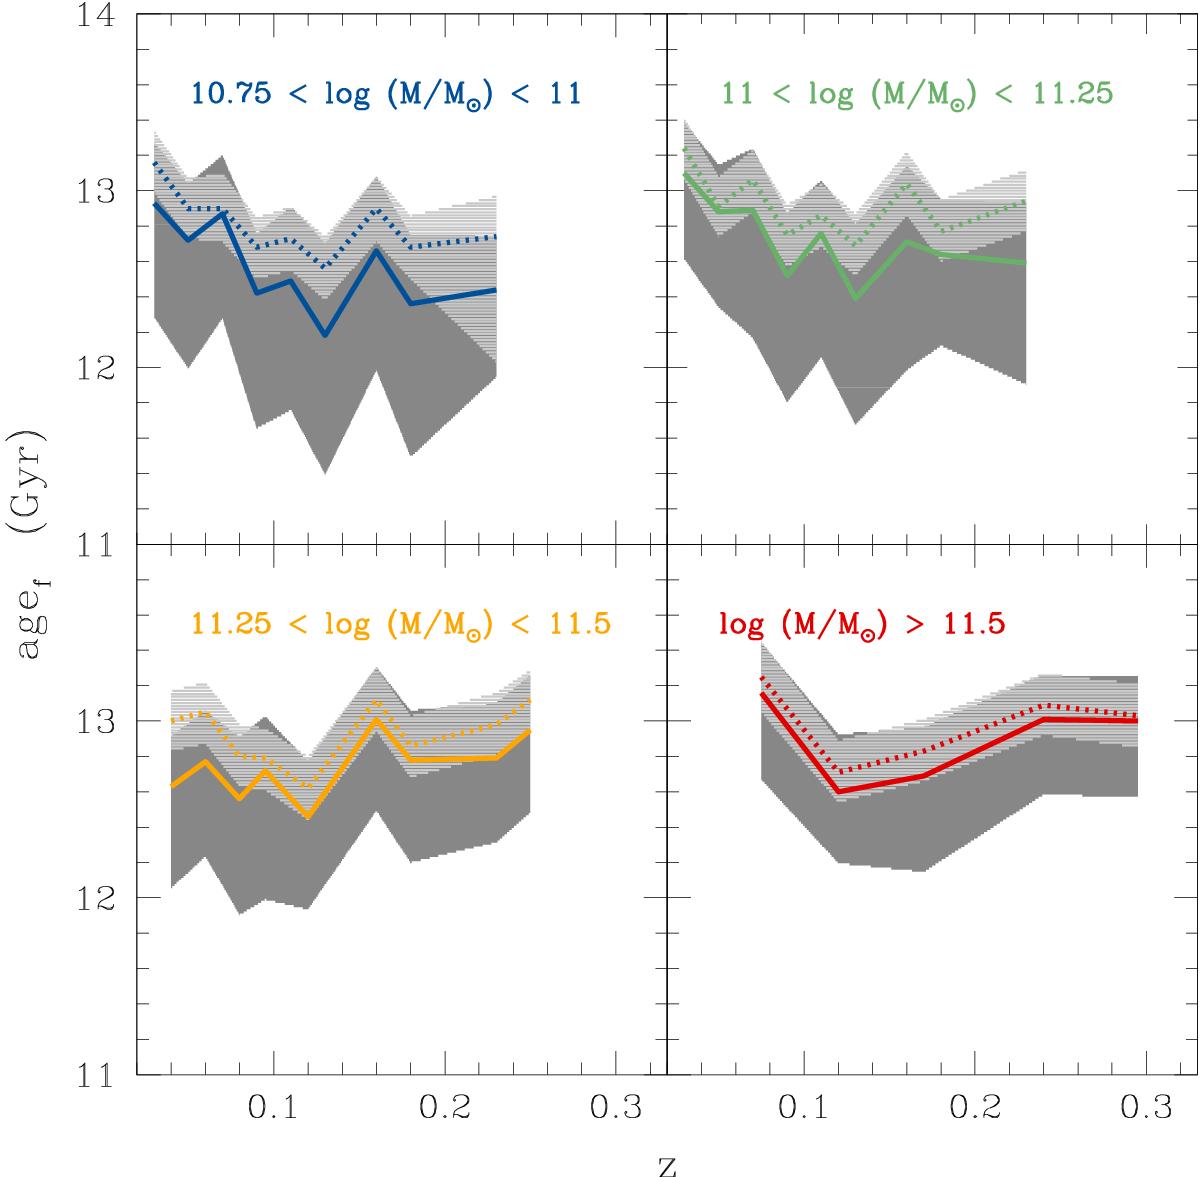
agef-redshift relations for the four mass bins. Solid and dotted curves (colour coded as in Fig. 10) are the ages of formation as a function of redshift referring, respectively to BC03 and MS11 spectral synthesis models. Dark-grey and light-grey shaded regions are the 1σ dispersions calculated starting from the 16th (P16) and 84th (P84) percentiles of the mass fraction cumulative function for BC03 and MS11 models, respectively.
Current usage metrics show cumulative count of Article Views (full-text article views including HTML views, PDF and ePub downloads, according to the available data) and Abstracts Views on Vision4Press platform.
Data correspond to usage on the plateform after 2015. The current usage metrics is available 48-96 hours after online publication and is updated daily on week days.
Initial download of the metrics may take a while.