Fig. 11
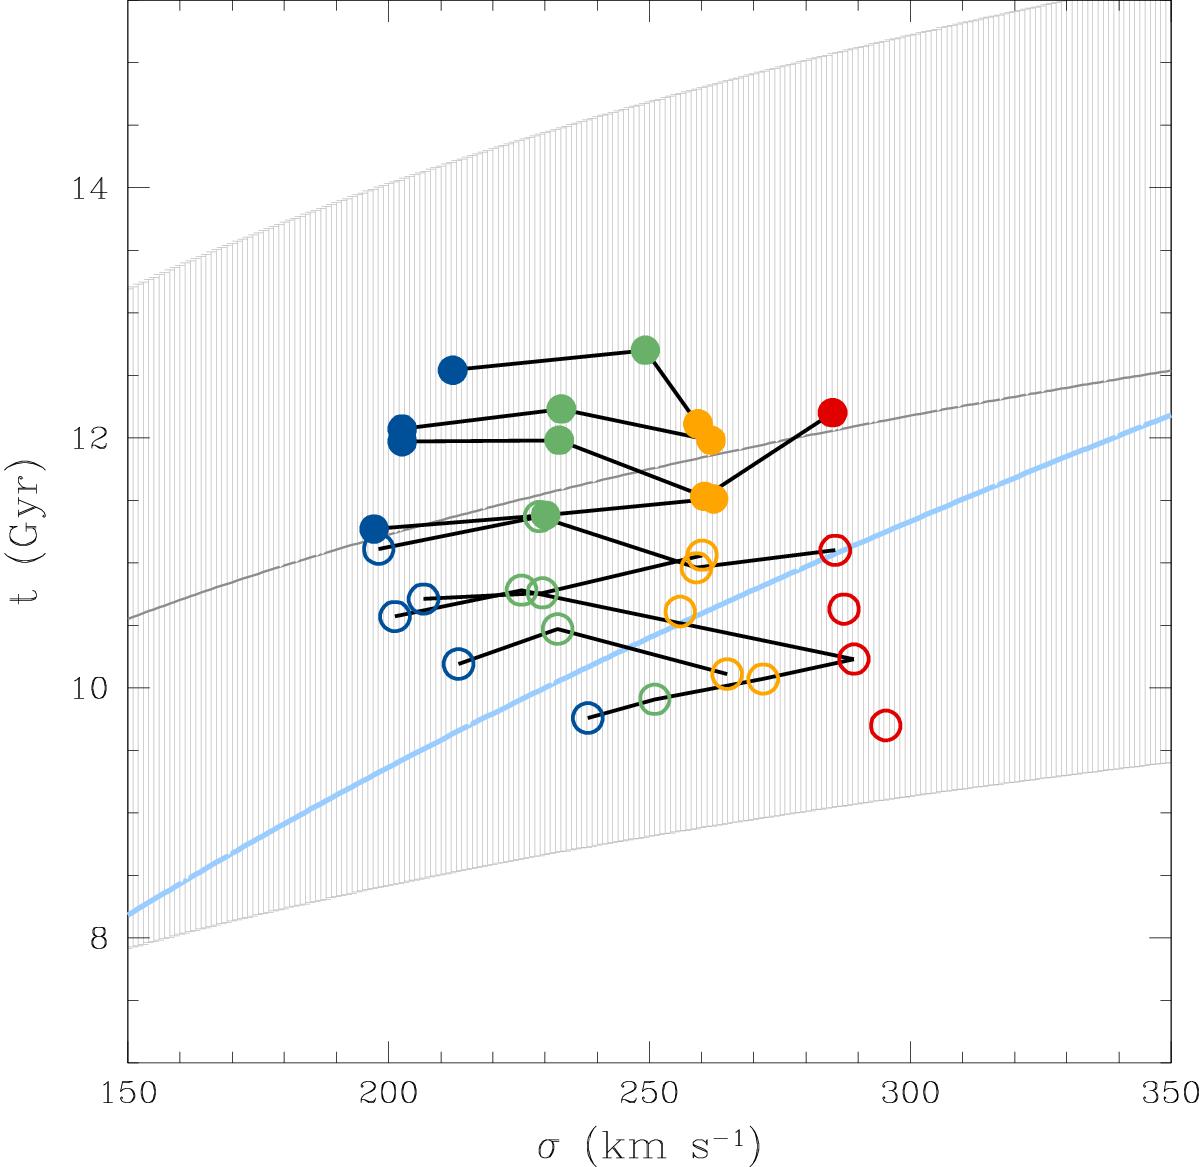
Mass-weighted ages as a function of the velocity dispersion σ for BC03 models (symbols are colour-coded as in Fig. 10). Filled circles are the mass-weighted ages corresponding to z< 0.1, matching the redshifts analyzed by McDermid et al. (2015), with black curves linking the mass-weighted ages related to different mass bins but similar redshifts. The grey curve is the age – σ relation inferred by McDermid et al. (2015) with its dispersion (grey shaded region), while the light-blue curve is the Thomas et al. (2010) relation (its dispersion, not shown in the figure, is in the order of 60%).
Current usage metrics show cumulative count of Article Views (full-text article views including HTML views, PDF and ePub downloads, according to the available data) and Abstracts Views on Vision4Press platform.
Data correspond to usage on the plateform after 2015. The current usage metrics is available 48-96 hours after online publication and is updated daily on week days.
Initial download of the metrics may take a while.