Fig. 1
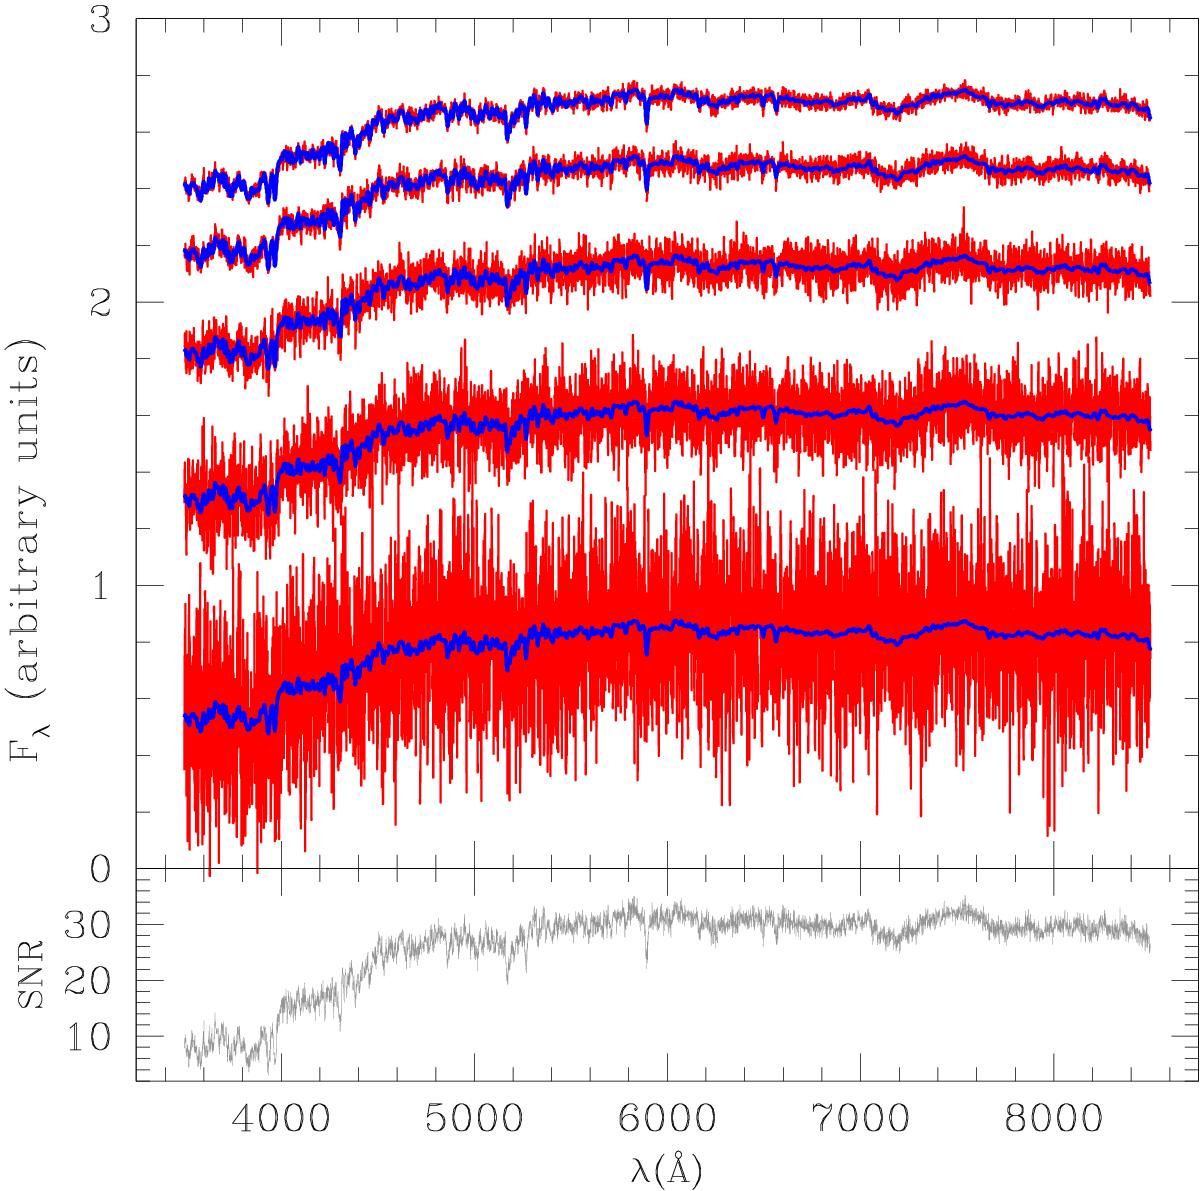
Simulated spectra of a CSP at 13 Gyr from the onset of the SFH (exponentially delayed with τ = 0.3 Gyr), with solar metallicity and S/N 2, 5, 10, 20 and 30, increasing from bottom to top. For each S/N, the blue curve is the starting BC03 model used for the simulation, while the red curve is the simulated spectrum. The lower panel shows the behaviour of the S/N as a function of wavelength for a simulated spectra with S/N = 30 in the 6500–7000 Å window.
Current usage metrics show cumulative count of Article Views (full-text article views including HTML views, PDF and ePub downloads, according to the available data) and Abstracts Views on Vision4Press platform.
Data correspond to usage on the plateform after 2015. The current usage metrics is available 48-96 hours after online publication and is updated daily on week days.
Initial download of the metrics may take a while.