Free Access
Fig. 7
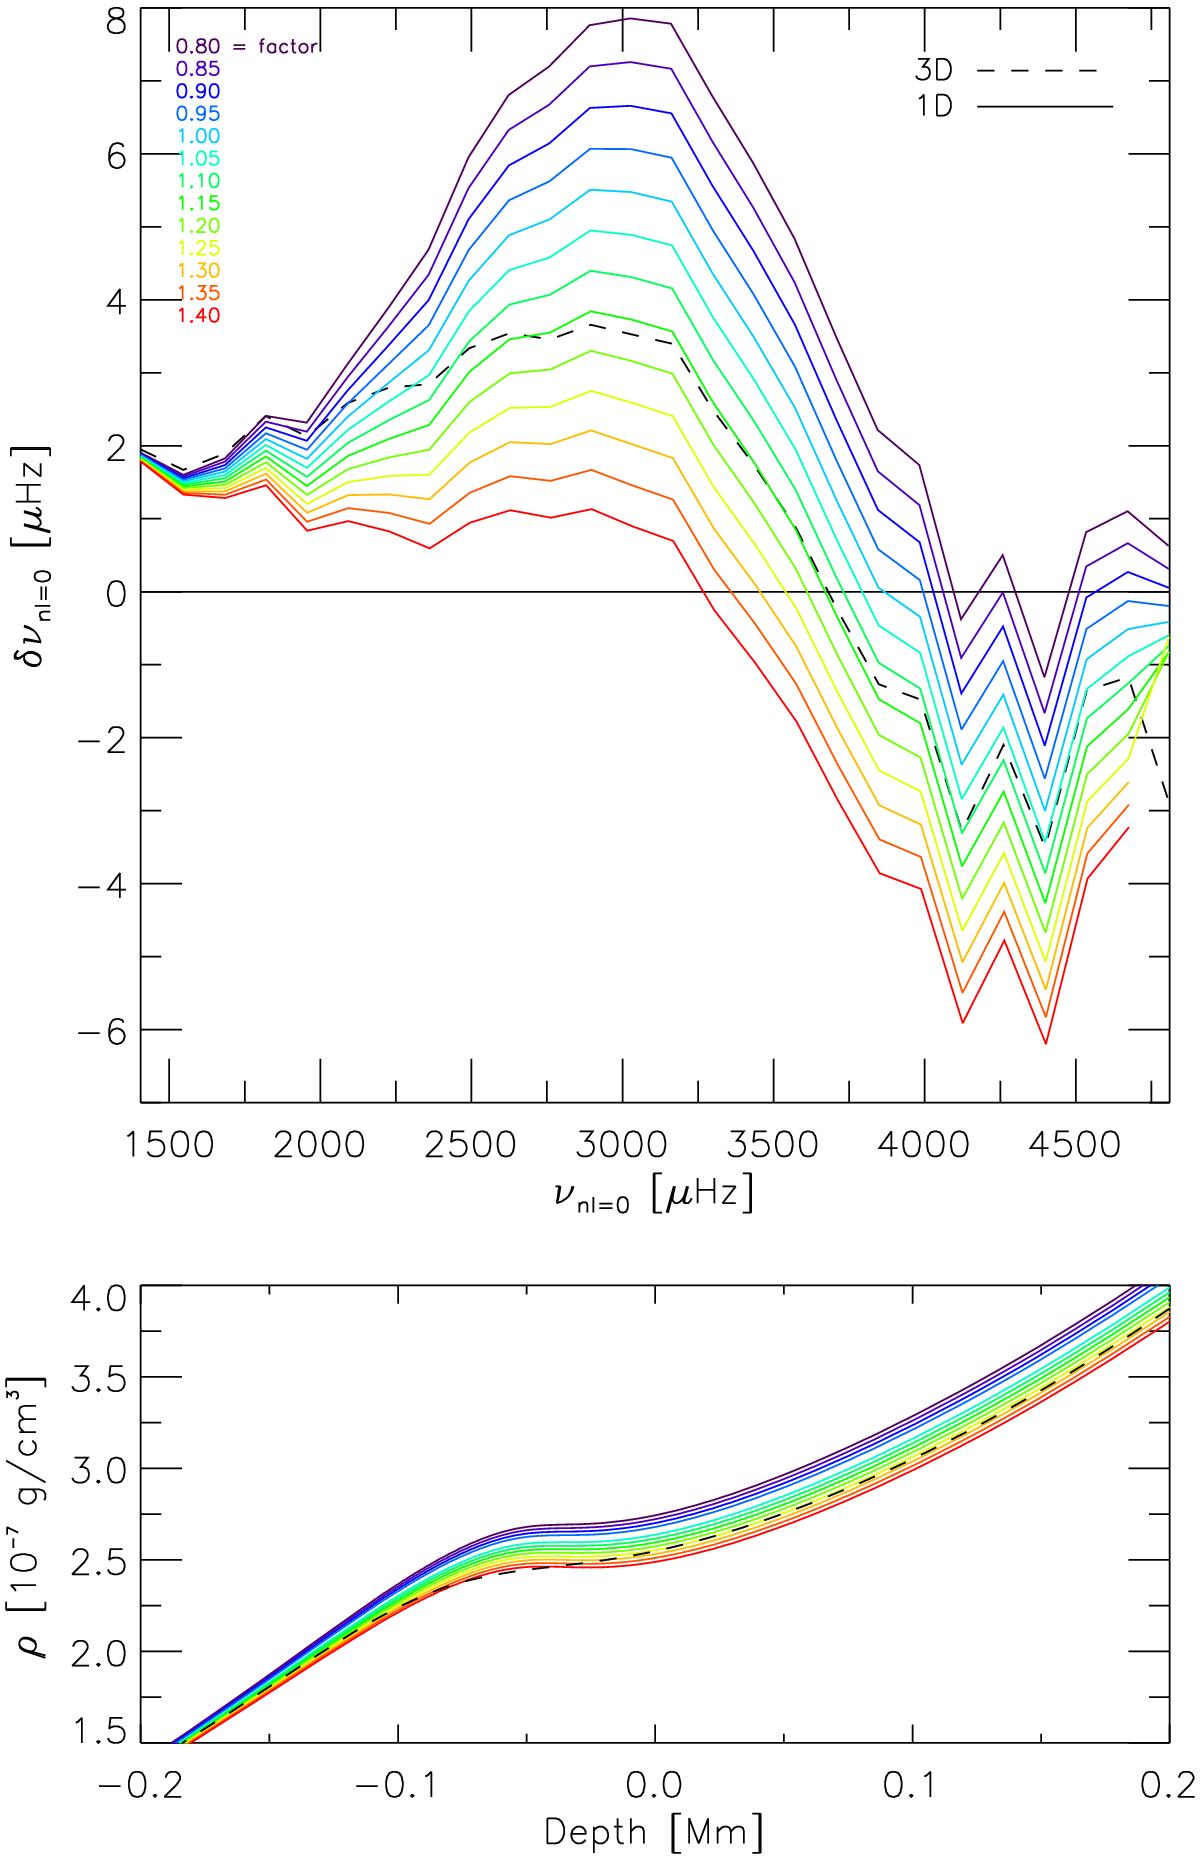
Top panel: similar to Fig. 5a, but showing models with different density corrections. The line with the density correction of 1.0 is the same as shown in Fig. 6b (blue dashed line). Bottom panel: density profiles. In both panels, the 3D-corrected model is also shown for comparison (black dashed line).
This figure is made of several images, please see below:
Current usage metrics show cumulative count of Article Views (full-text article views including HTML views, PDF and ePub downloads, according to the available data) and Abstracts Views on Vision4Press platform.
Data correspond to usage on the plateform after 2015. The current usage metrics is available 48-96 hours after online publication and is updated daily on week days.
Initial download of the metrics may take a while.