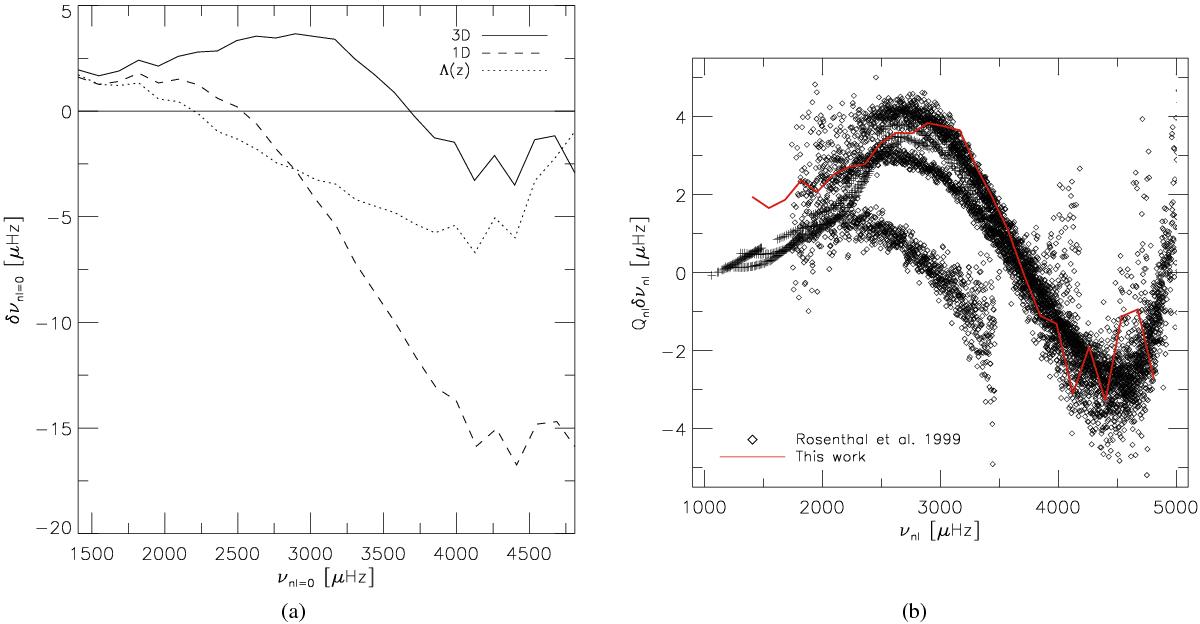
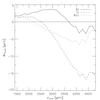
Fig. 5

a) Frequency residuals vs. frequency for two solar models in comparison with solar observations for a low-degree mode with l = 0. The differences are retrieved by ![]() . Shown are the 3D corrected model (black solid line), the standard 1D solar model (dashed lines) and a 1D model expanded with the turbulent elevation (dotted lines; see Eq. (7)). The height of zero differences is indicated (horizontal solid line). b) We also show the residuals for different modes scaled with Qnl resulting from a solar model corrected with 3D model (GGM: gas gamma model) published by (Rosenthal et al. 1999; black symbols) in comparison with our result for l = 0 (red solid line).
. Shown are the 3D corrected model (black solid line), the standard 1D solar model (dashed lines) and a 1D model expanded with the turbulent elevation (dotted lines; see Eq. (7)). The height of zero differences is indicated (horizontal solid line). b) We also show the residuals for different modes scaled with Qnl resulting from a solar model corrected with 3D model (GGM: gas gamma model) published by (Rosenthal et al. 1999; black symbols) in comparison with our result for l = 0 (red solid line).
Current usage metrics show cumulative count of Article Views (full-text article views including HTML views, PDF and ePub downloads, according to the available data) and Abstracts Views on Vision4Press platform.
Data correspond to usage on the plateform after 2015. The current usage metrics is available 48-96 hours after online publication and is updated daily on week days.
Initial download of the metrics may take a while.


