Fig. 3
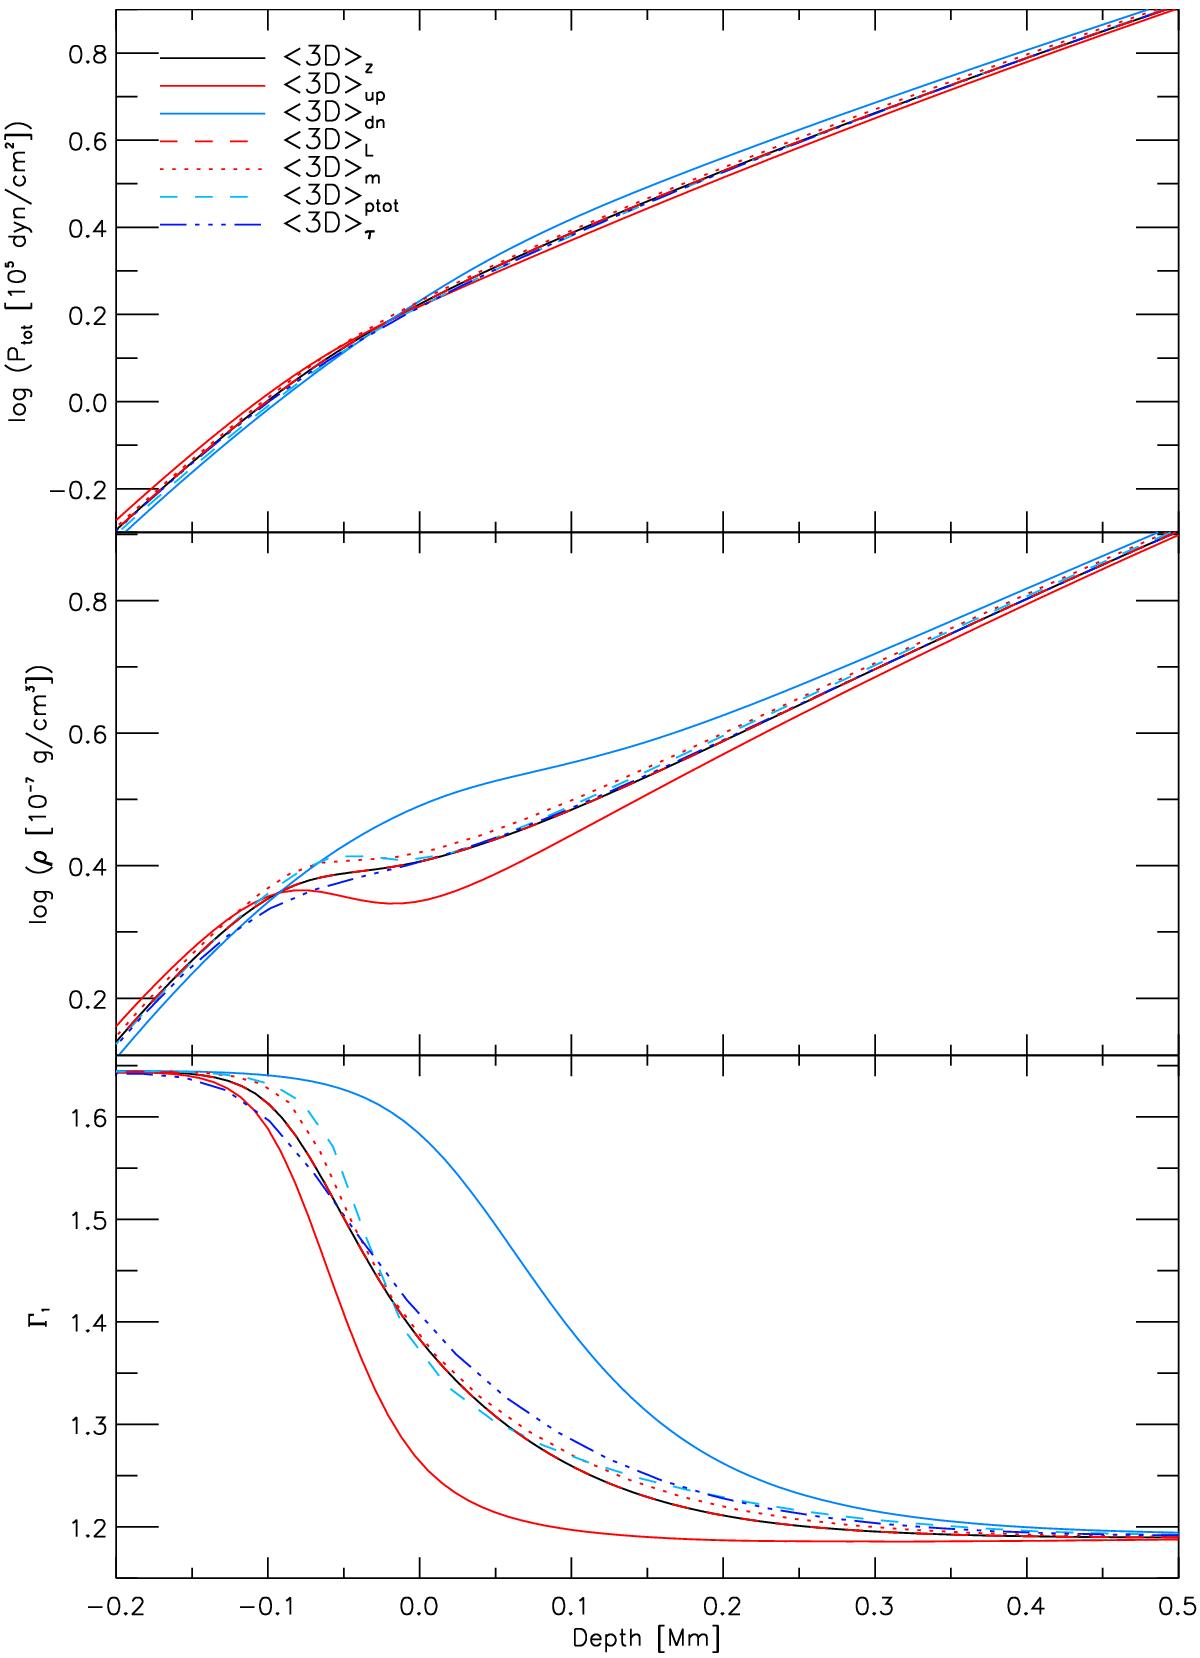
Similar to Fig. 1, but showing models with different ⟨3D⟩ averages. The geometrically averaged model, z (solid black line), is identical to the model shown in Fig. 1 (black solid line). Inward of a depth of roughly −0.1 Mm, the averages of the upflows, ⟨3D⟩up, are the lowest curves, while the downflows, ⟨3D⟩dn, are the uppermost curves in all three panels.
Current usage metrics show cumulative count of Article Views (full-text article views including HTML views, PDF and ePub downloads, according to the available data) and Abstracts Views on Vision4Press platform.
Data correspond to usage on the plateform after 2015. The current usage metrics is available 48-96 hours after online publication and is updated daily on week days.
Initial download of the metrics may take a while.