Fig. 1
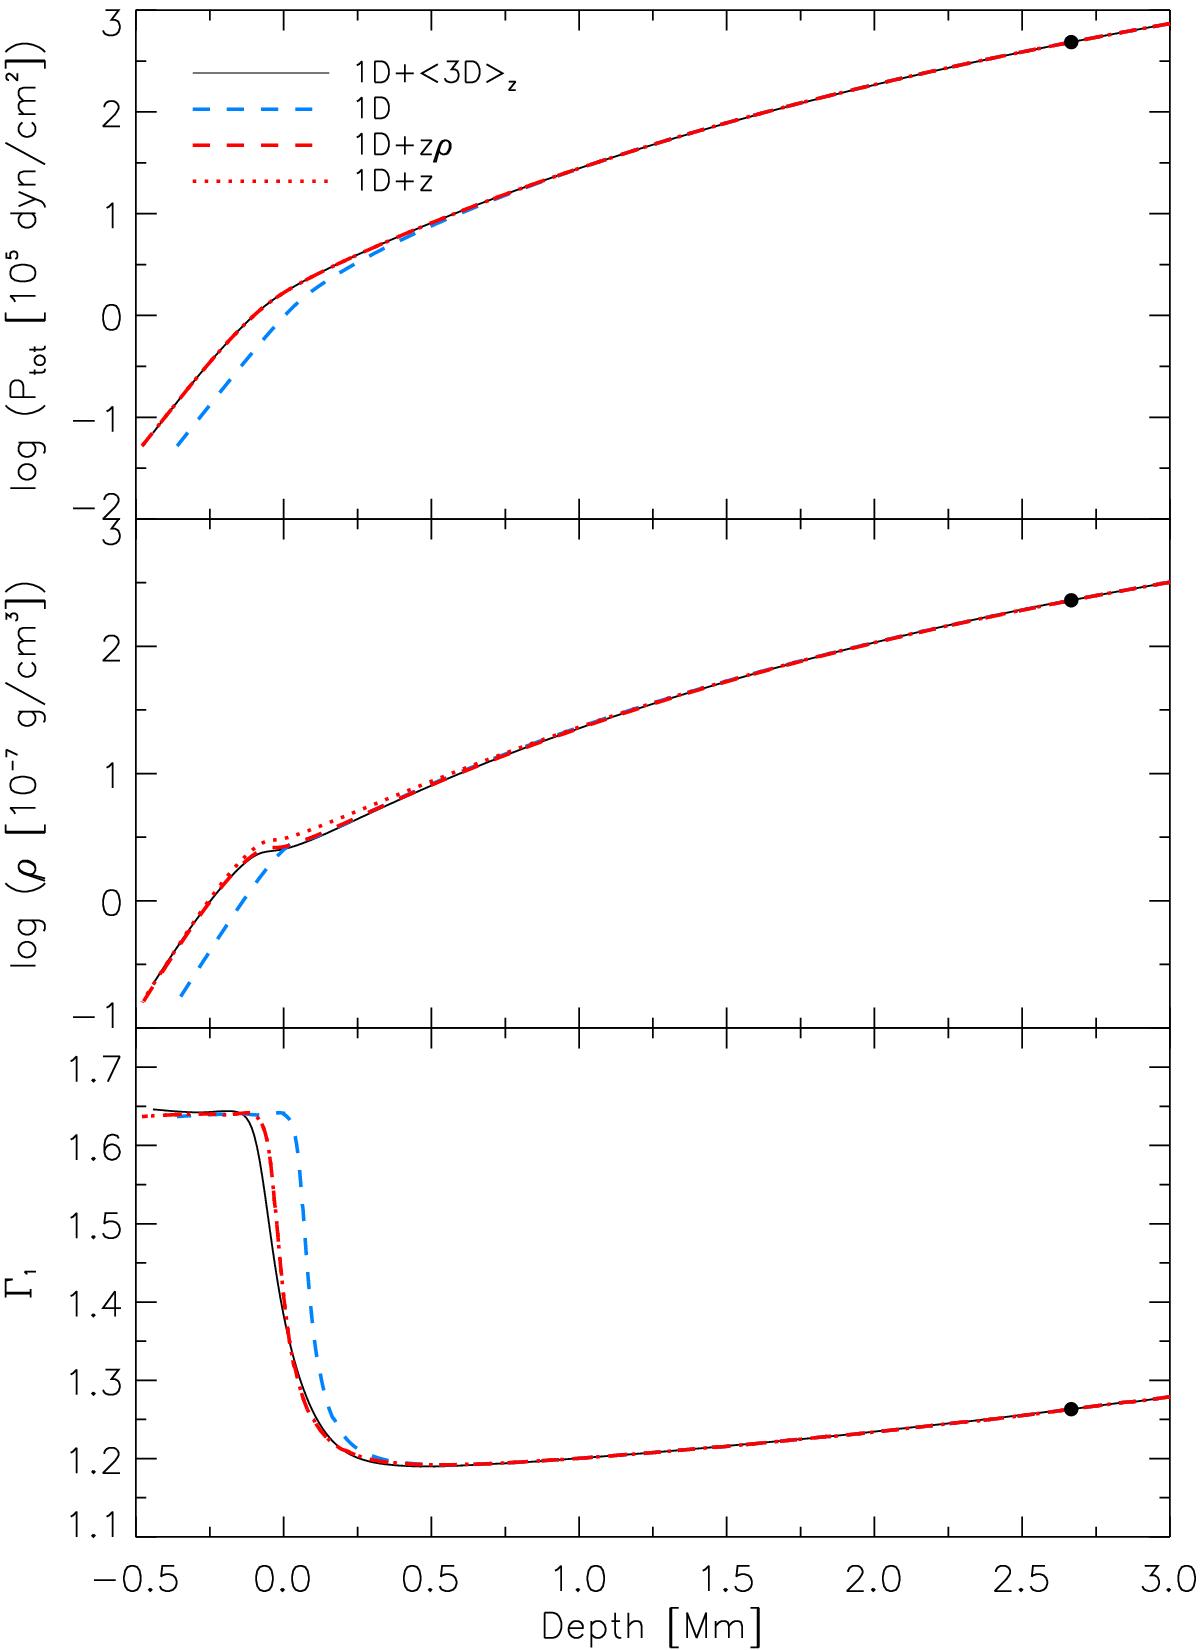
Total pressure, density, and adiabatic exponent for the 1D model combined with the ⟨3D⟩z model. We marked the location of the transition between ⟨3D⟩z and 1D (black dot). In additition to the original 1D model (blue dashed line), we also show the values of the 1D model corrected for both the geometrical depth and density (red dashed line) and corrected for the depth alone (red dotted line).
Current usage metrics show cumulative count of Article Views (full-text article views including HTML views, PDF and ePub downloads, according to the available data) and Abstracts Views on Vision4Press platform.
Data correspond to usage on the plateform after 2015. The current usage metrics is available 48-96 hours after online publication and is updated daily on week days.
Initial download of the metrics may take a while.