Free Access
Fig. 6
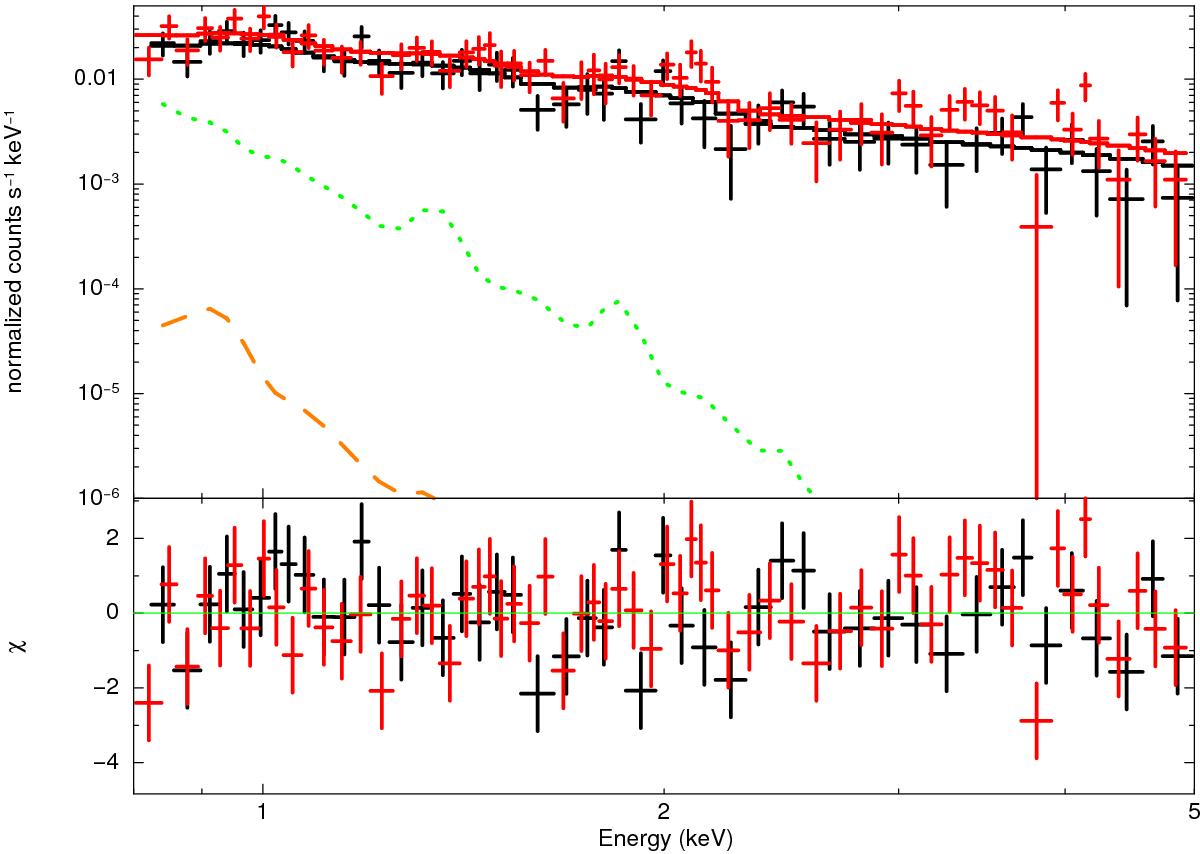
Suzaku spectra and residuals of the two outskirts regions for the north observation and XIS1. The solid lines show the best fit model, the orange dashed line shows the model component for the local background, and the green dotted line corresponds to the halo background model component.
Current usage metrics show cumulative count of Article Views (full-text article views including HTML views, PDF and ePub downloads, according to the available data) and Abstracts Views on Vision4Press platform.
Data correspond to usage on the plateform after 2015. The current usage metrics is available 48-96 hours after online publication and is updated daily on week days.
Initial download of the metrics may take a while.