Fig. 8
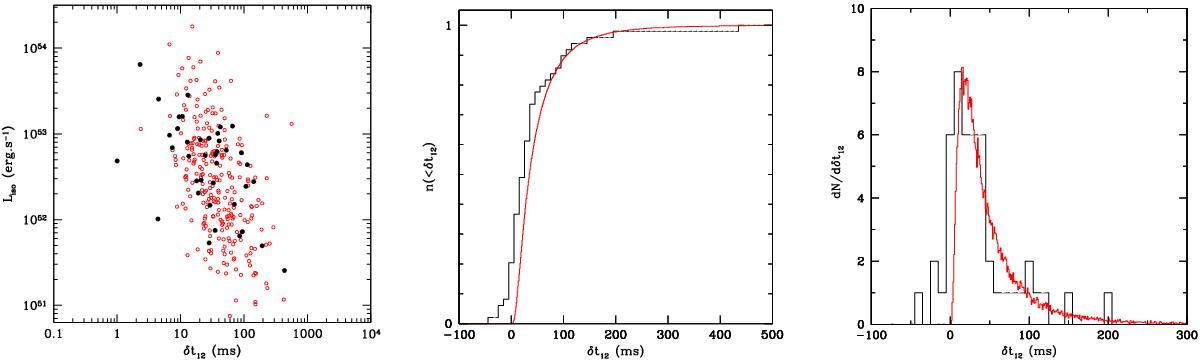
Lag-luminosity relation, cumulative, and differential distributions of lags for δep = 0.5, δa = δb = 0.1, and ⟨tp⟩ / |C | given by Eq. (15) with γ = 0.15; left panel: 250 simulated events (red circles) and data points from Heussaff (2015; black dots); middle panel: cumulative distribution of lags; right panel: differential distribution of lags. In the middle and right panels the observed distribution is binned in interval of 10 ms.
Current usage metrics show cumulative count of Article Views (full-text article views including HTML views, PDF and ePub downloads, according to the available data) and Abstracts Views on Vision4Press platform.
Data correspond to usage on the plateform after 2015. The current usage metrics is available 48-96 hours after online publication and is updated daily on week days.
Initial download of the metrics may take a while.