Fig. 6
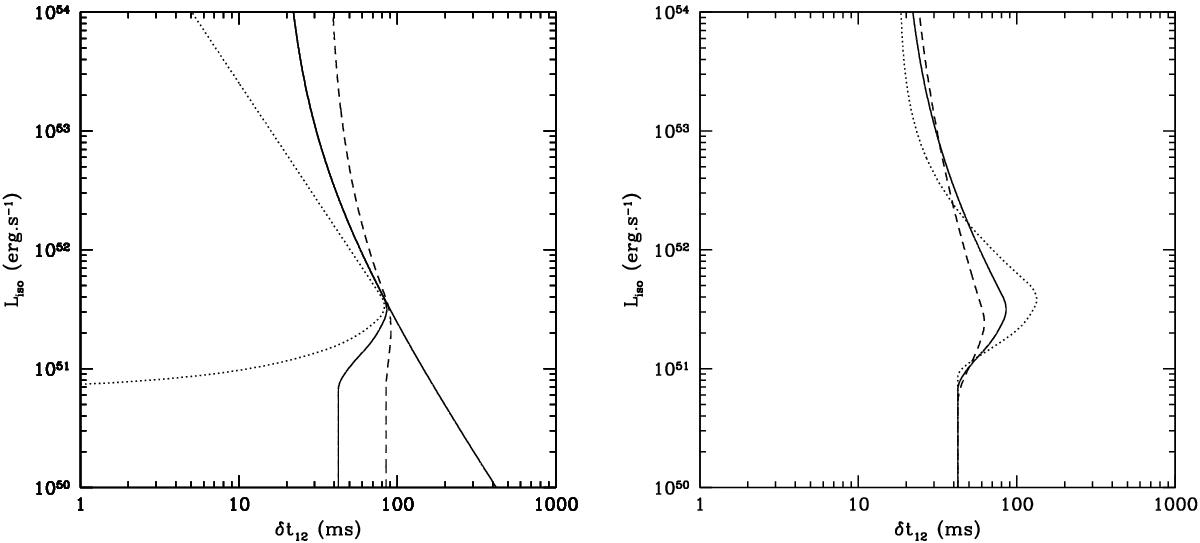
a)Left panel: lag-luminosity relation for α = −1, β = −2.3, tp/ C = 0.3 s, δep = 0.5, and δa = δb = 0 (dotted line), 0.1 (full line), and 0.2 (dashed line). The full line that extends to large lag values at low luminosity corresponds to a power-law spectrum with α = −1 and an exponential cut-off; b) right panel: same as a) for the case δep = −0.5 and δa = δb = 0.1 (full line), but also with a modified Band spectrum with n = 2 (dotted line) and n = 0.67 (dashed line).
Current usage metrics show cumulative count of Article Views (full-text article views including HTML views, PDF and ePub downloads, according to the available data) and Abstracts Views on Vision4Press platform.
Data correspond to usage on the plateform after 2015. The current usage metrics is available 48-96 hours after online publication and is updated daily on week days.
Initial download of the metrics may take a while.