Fig. 2
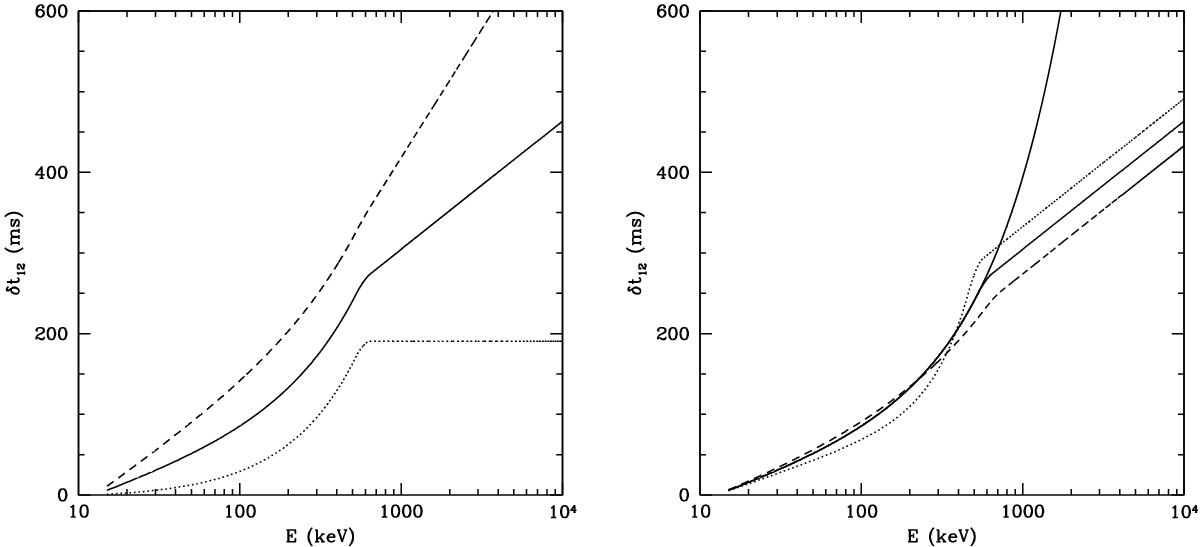
a)Left panel: lags between the low energy band [10–20] keV and a moving band [E-1.25E] as a function of E (in keV) for a pulse with tp/ C = 0.3 s and a Band spectrum (n = 1 in Eq. (4)) with Ep = 500 keV, α = −1, β = −2.3 for three different cases of spectral evolution: δep = −0.5 and δa = δb = 0 (dotted line), 0.1 (full line), and 0.2 (dashed line); b) right panel: same as a) for the case δep = −0.5 and δa = δb = 0.1 (full line), but also with a modified Band spectrum with n = 2 (dotted line) and n = 0.67 (dashed line). The full line with no break at 500 keV corresponds to a power-law spectrum with α = −1 and an exponential cut-off.
Current usage metrics show cumulative count of Article Views (full-text article views including HTML views, PDF and ePub downloads, according to the available data) and Abstracts Views on Vision4Press platform.
Data correspond to usage on the plateform after 2015. The current usage metrics is available 48-96 hours after online publication and is updated daily on week days.
Initial download of the metrics may take a while.