Free Access
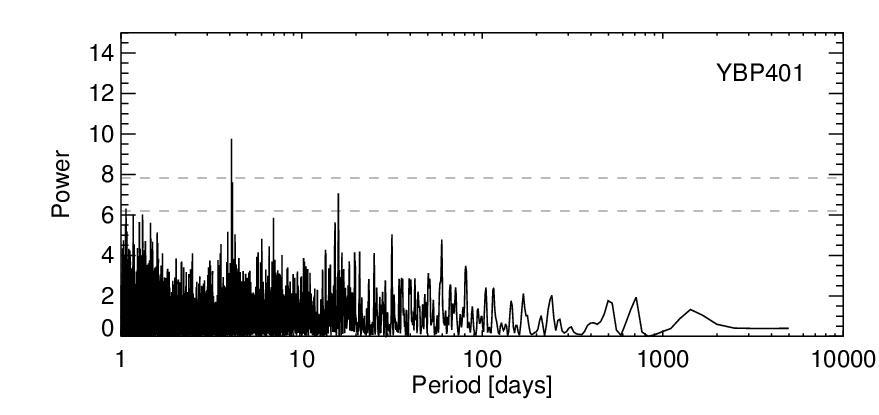
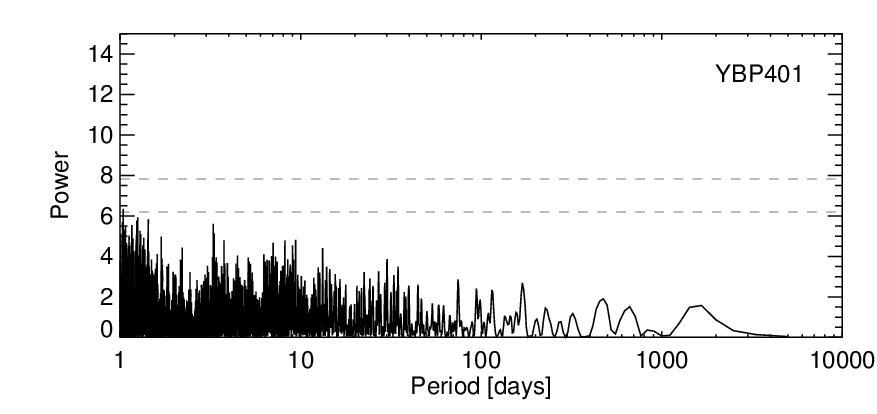
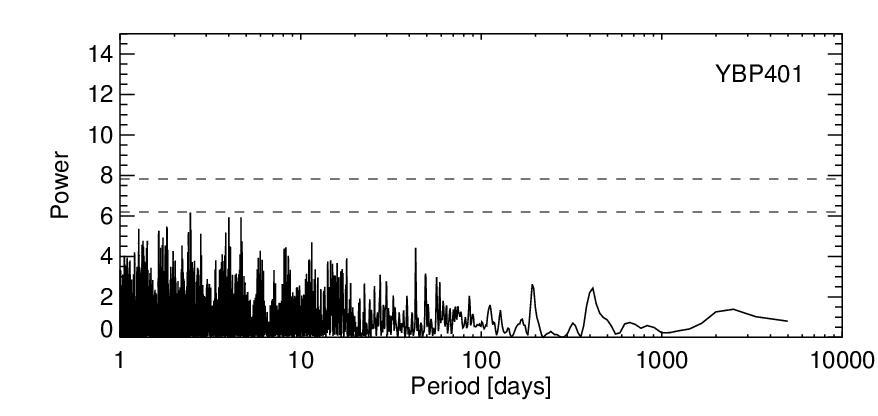
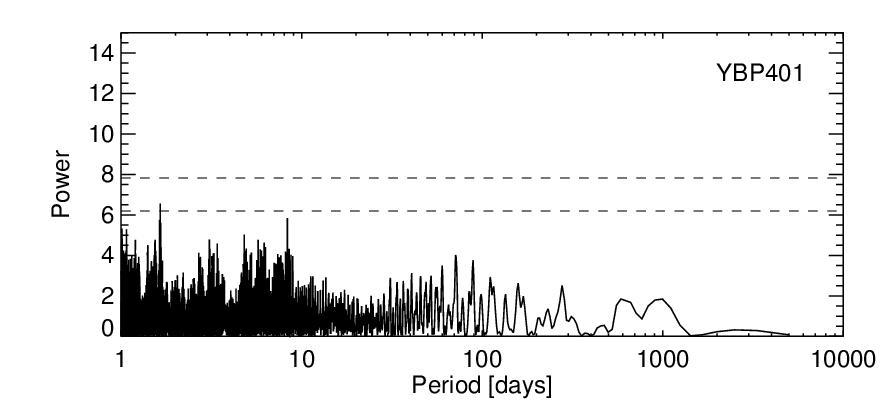
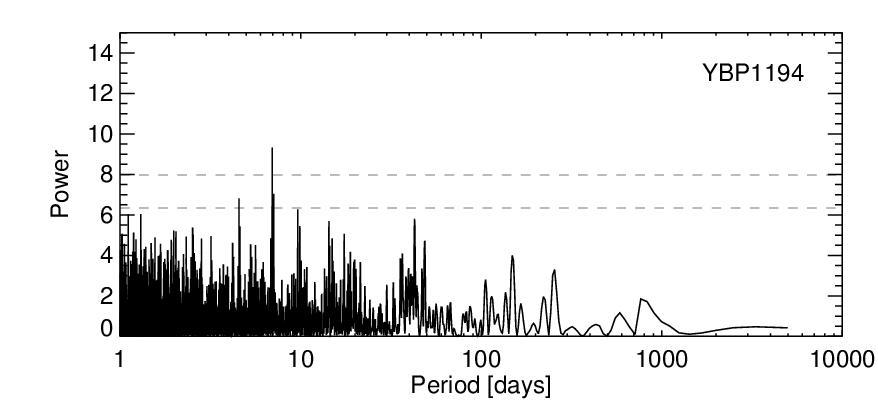
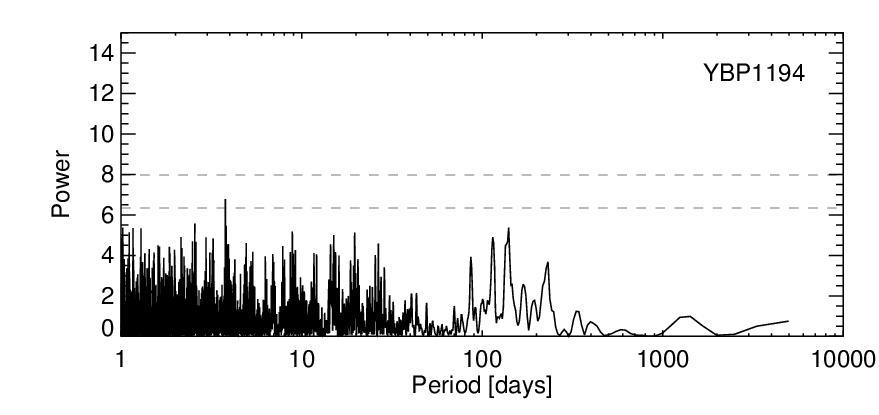
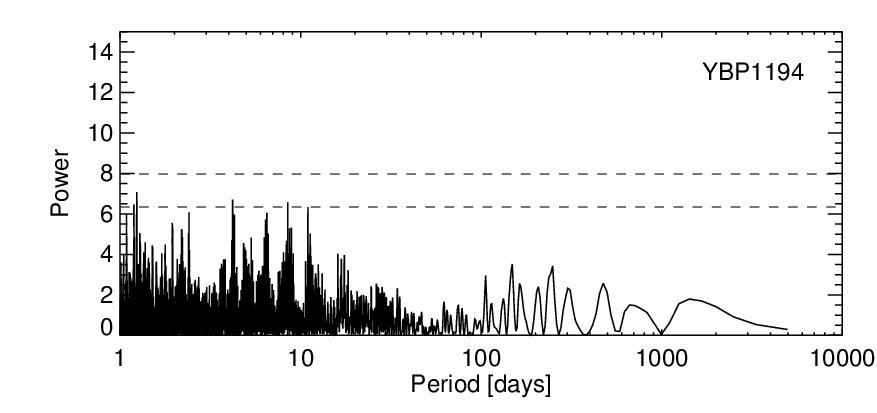
Fig. A.1
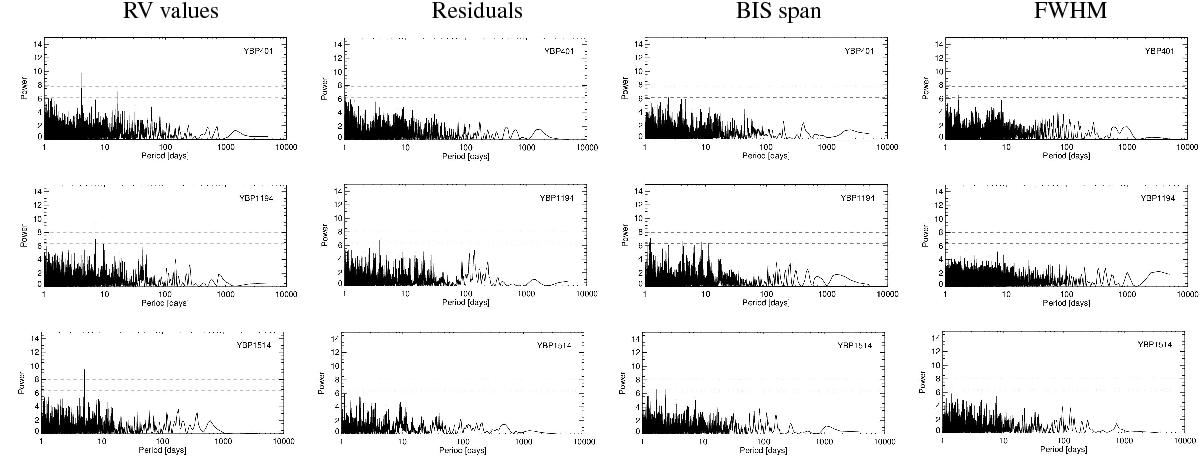
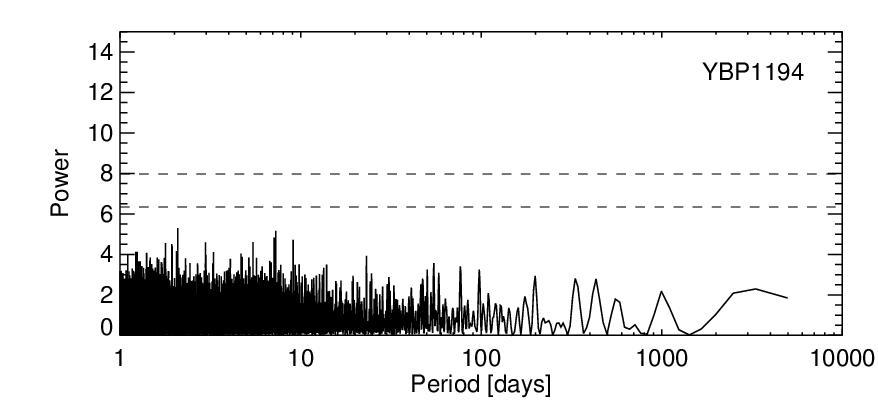
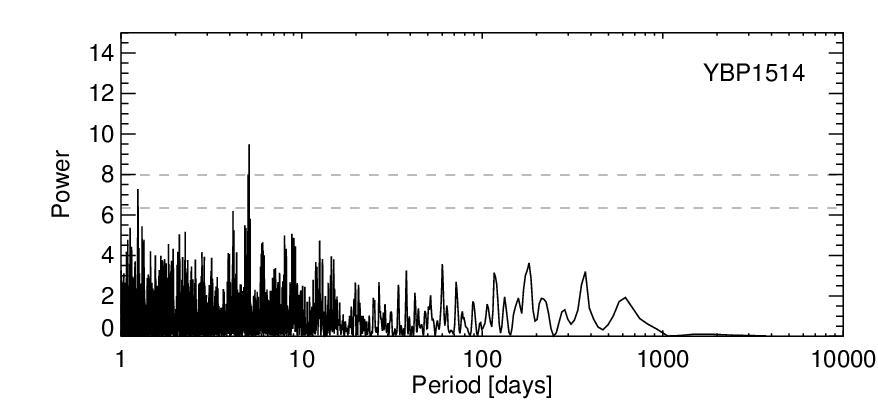
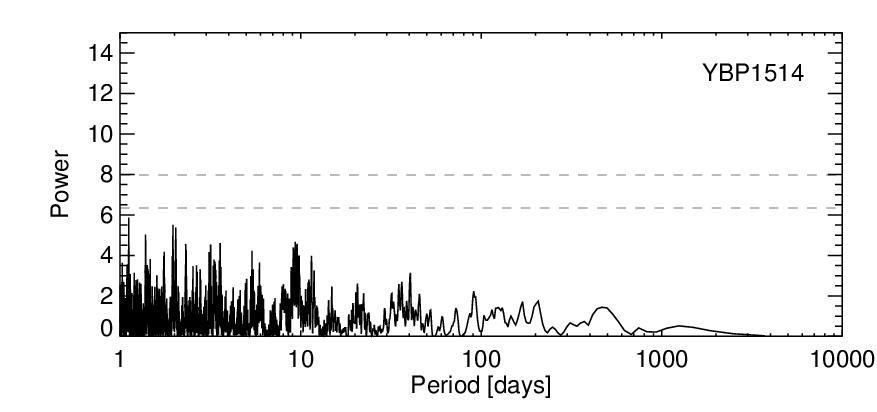
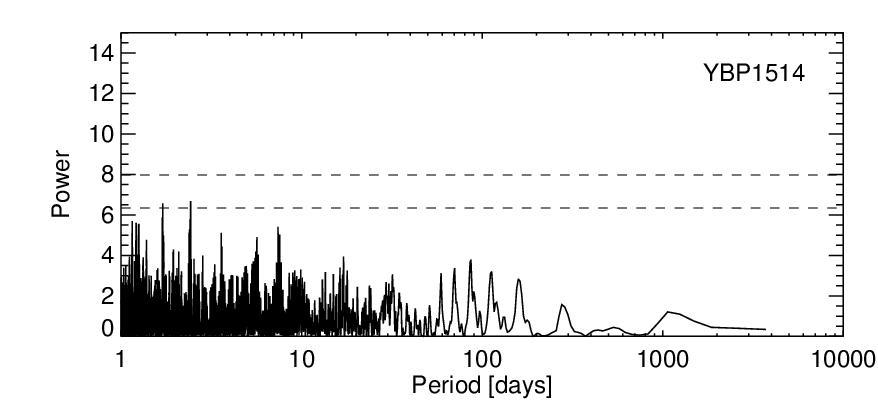
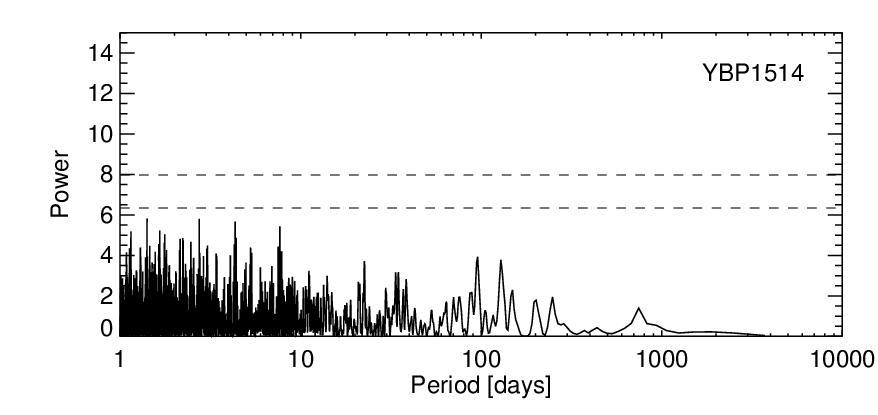
Top: Lomb-Scargle periodogram of the RV measurements, residuals, bisector span, and FWHM for YBP401. Central: same plots for YBP1194. Bottom: same plots for YBP1514. The dashed lines correspond to 5% and 1% false-alarm probabilities, calculated according to Horne & Baliunas (1986) and white noise simulations.
This figure is made of several images, please see below:
Current usage metrics show cumulative count of Article Views (full-text article views including HTML views, PDF and ePub downloads, according to the available data) and Abstracts Views on Vision4Press platform.
Data correspond to usage on the plateform after 2015. The current usage metrics is available 48-96 hours after online publication and is updated daily on week days.
Initial download of the metrics may take a while.