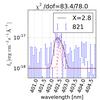
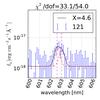
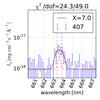
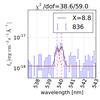
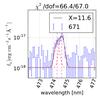
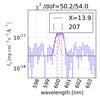
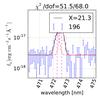
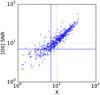
Fig. 2

Example of fits of the [Oii] doublets by a double Gaussian on some spectra from plate 8130. Each spectrum (blue error bars) is labeled by its fiber number and the fits (black solid) are characterized by the χ2/d.o.f. given above each panel. We show the two individual Gaussians as red dashes. The vertical magenta dashed lines are at (1 + z)λ[OII]. The panels are ordered by increasing value of X. Around a value of X = 7, the blended doublet starts to be a better model than a single Gaussian. The last panel shows the [Oii] S/N vs. X with horizontal and vertical solid lines at a value of 7. X is the S/N with which the two components of the doublets are detected.
Current usage metrics show cumulative count of Article Views (full-text article views including HTML views, PDF and ePub downloads, according to the available data) and Abstracts Views on Vision4Press platform.
Data correspond to usage on the plateform after 2015. The current usage metrics is available 48-96 hours after online publication and is updated daily on week days.
Initial download of the metrics may take a while.