Fig. 1
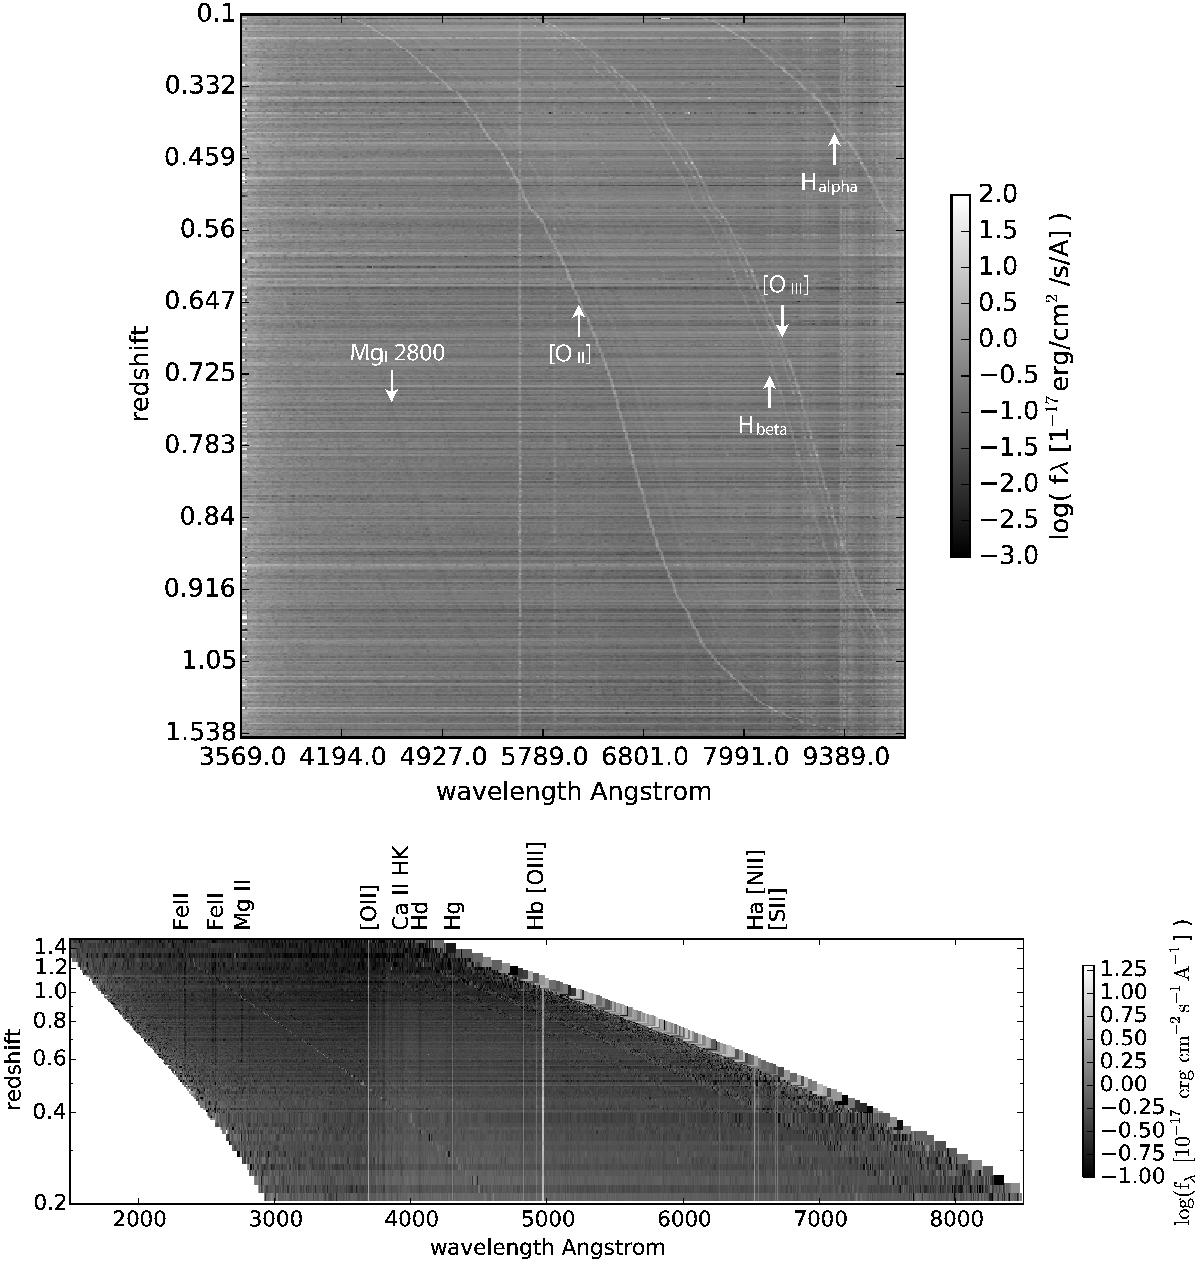
Top panel: ELG spectra represented in the observed frame sorted by redshift. Each horizontal line corresponds to one spectrum. Vertical patterns correspond to the residuals of the sky subtraction. Diagonal patterns are the emission and absorption lines seen in the galaxy spectra. As redshift increases, the [Oii] , Hβ, [Oiii] , and Hαemission lines become redshifted. Starting at redshift 0.5, UV absorption lines enter the spectrograph window. Bottom panel: ELG spectra stacked by 50, ordered as a function of redshift represented in the rest-frame. The spectral features align vertically and are detected with higher signal-to-noise-ratio, in particular the absorption lines in the UV. Extended details about the UV absorption and emission systems are given in Zhu et al. (2015).
Current usage metrics show cumulative count of Article Views (full-text article views including HTML views, PDF and ePub downloads, according to the available data) and Abstracts Views on Vision4Press platform.
Data correspond to usage on the plateform after 2015. The current usage metrics is available 48-96 hours after online publication and is updated daily on week days.
Initial download of the metrics may take a while.