Fig. 7
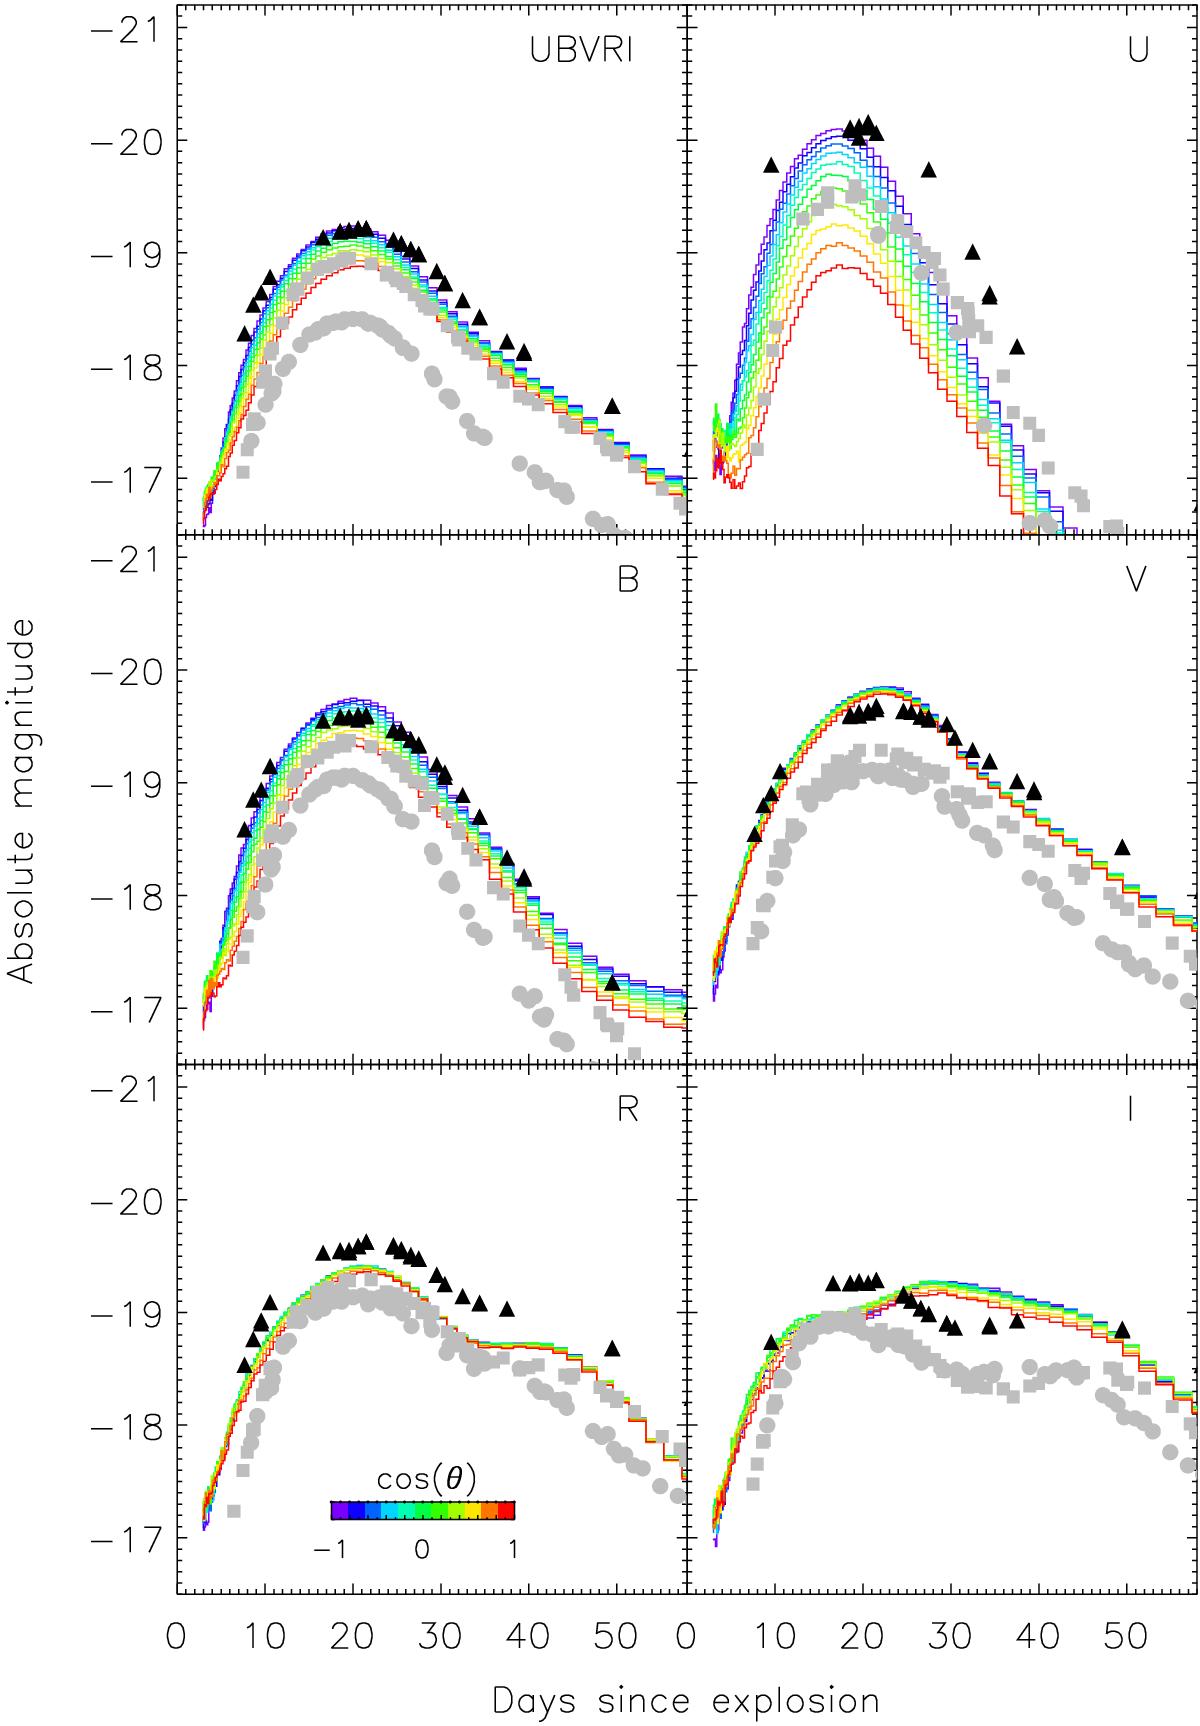
Synthetic broadband light curves for our model. Lines of different colour correspond to different viewing angles as indicated by the colour bar. Overplotted are observed light curves for the normal SNe Ia 2004eo (grey circles) and 2005cf (grey squares), and for the overluminous SN 1991T (black triangles). For the comparison we assume a B-band rise time of 19.6 d, which corresponds to the average B-band rise time of our model.
Current usage metrics show cumulative count of Article Views (full-text article views including HTML views, PDF and ePub downloads, according to the available data) and Abstracts Views on Vision4Press platform.
Data correspond to usage on the plateform after 2015. The current usage metrics is available 48-96 hours after online publication and is updated daily on week days.
Initial download of the metrics may take a while.