Fig. 6
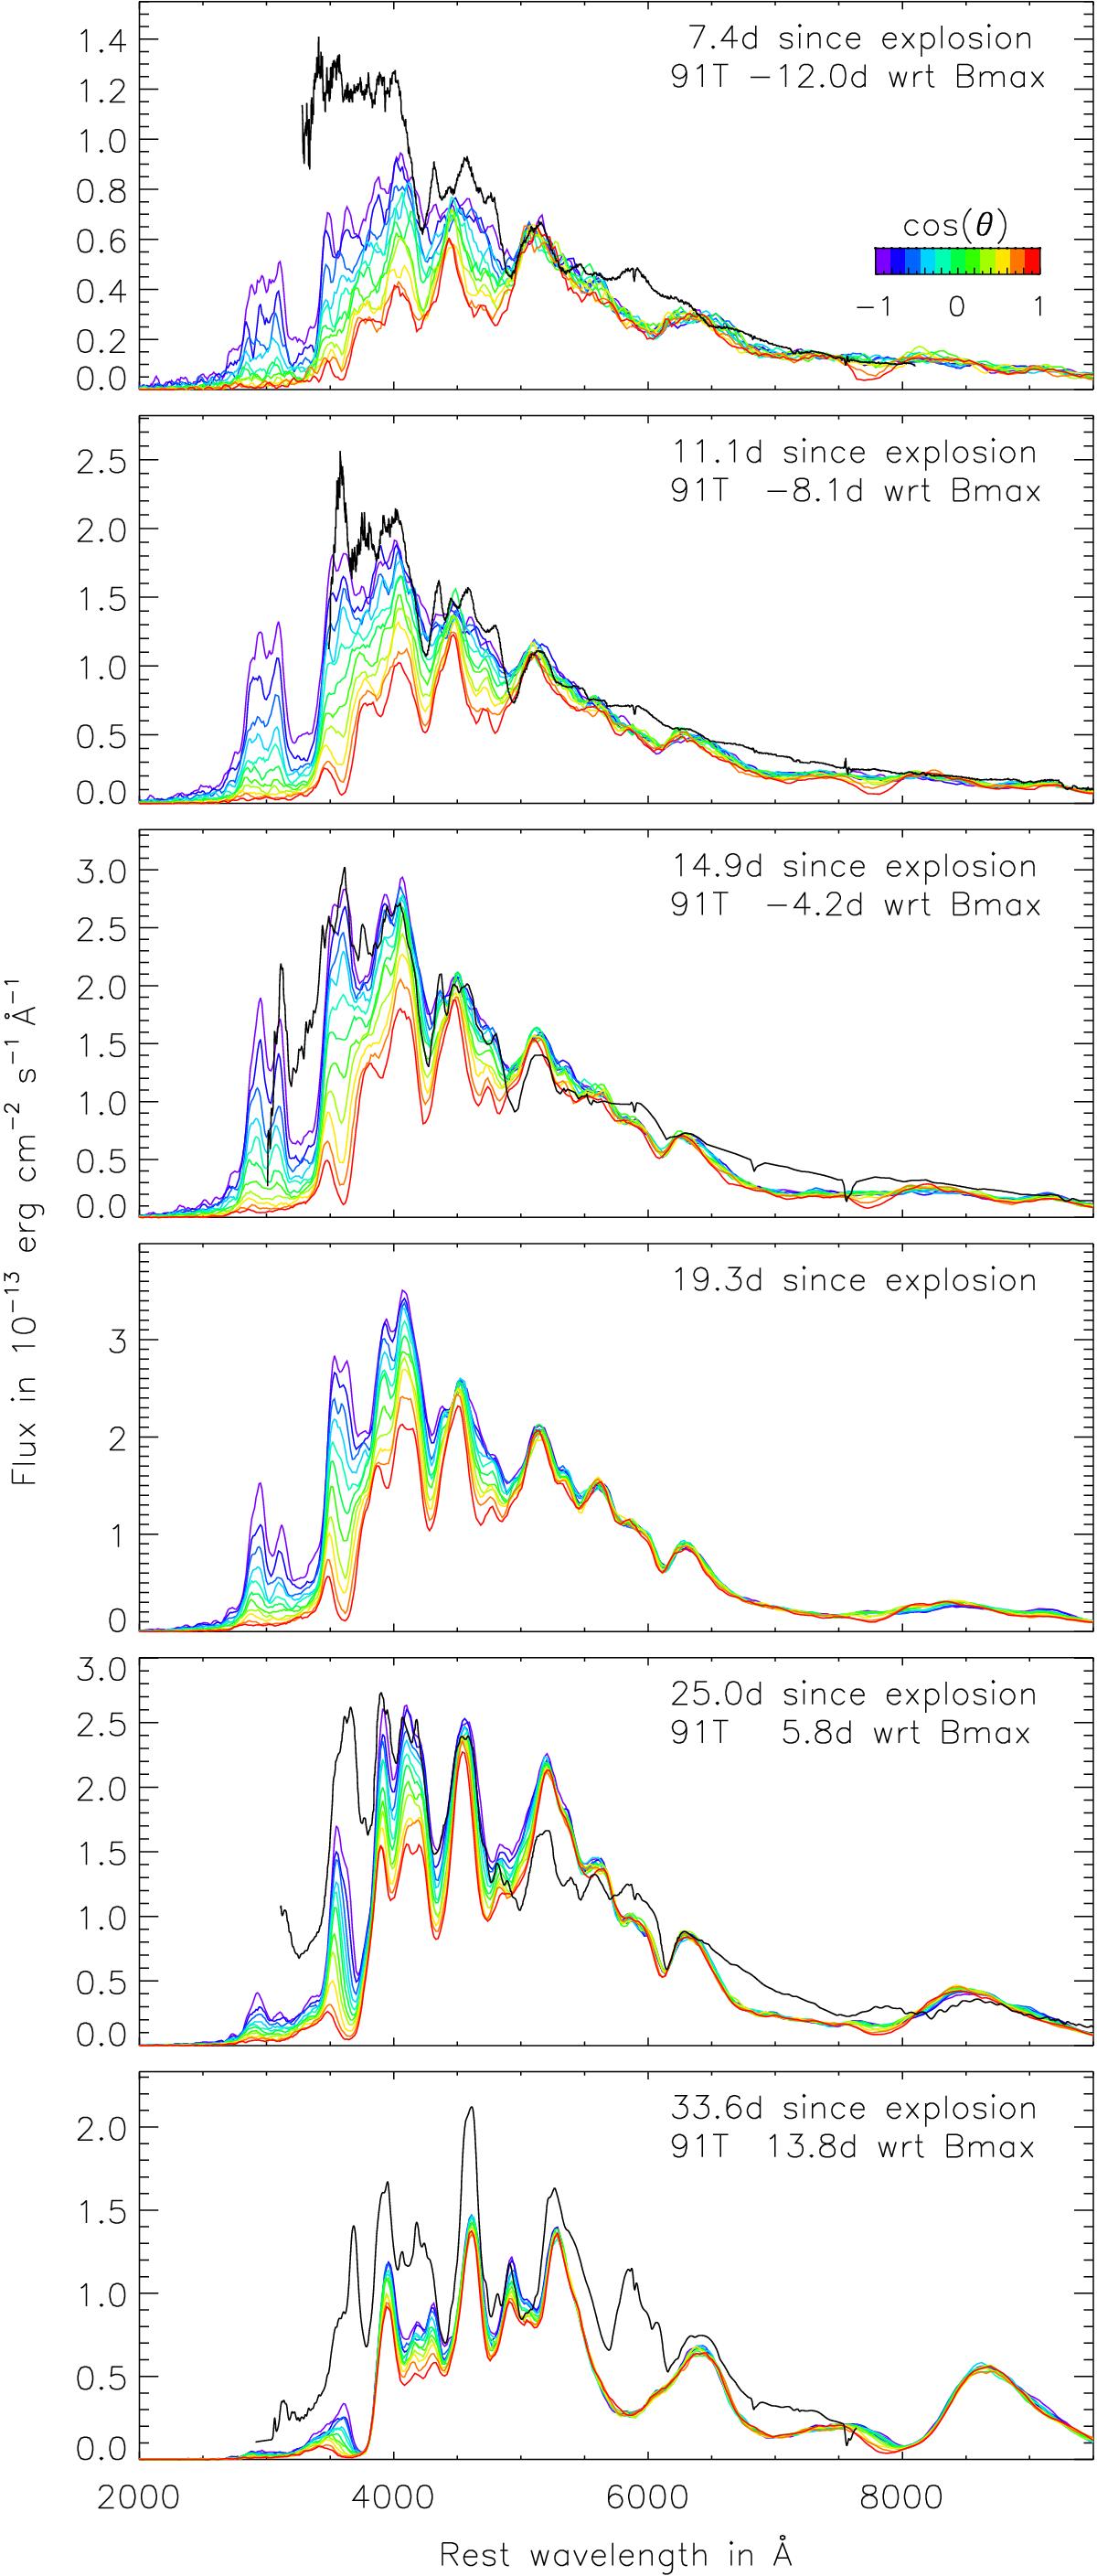
Time sequence of synthetic spectra for our model (lines of different colours correspond to different viewing angles as indicated by the colour bar). The snapshot at 19.3 d corresponds roughly to B-band maximum in the model, which occurs between 19.2 and 19.9 d depending on the viewing angle. The synthetic spectra have been smoothed with a Savitzky-Golay filter to reduce Monte Carlo noise. For comparison we overplot observed spectra of SN 1991T at corresponding epochs (black, the flux calibration has been checked against the photometry and adjusted when necessary). The observed spectra have been de-reddened (E(B − V) = 0.13, Phillips et al. 1992) and de-redshifted (z = 0.006059, from interstellar Na). We assumed a distance modulus of 30.76 to SN 1991T (Saha et al. 2006).
Current usage metrics show cumulative count of Article Views (full-text article views including HTML views, PDF and ePub downloads, according to the available data) and Abstracts Views on Vision4Press platform.
Data correspond to usage on the plateform after 2015. The current usage metrics is available 48-96 hours after online publication and is updated daily on week days.
Initial download of the metrics may take a while.