Free Access
Fig. 3
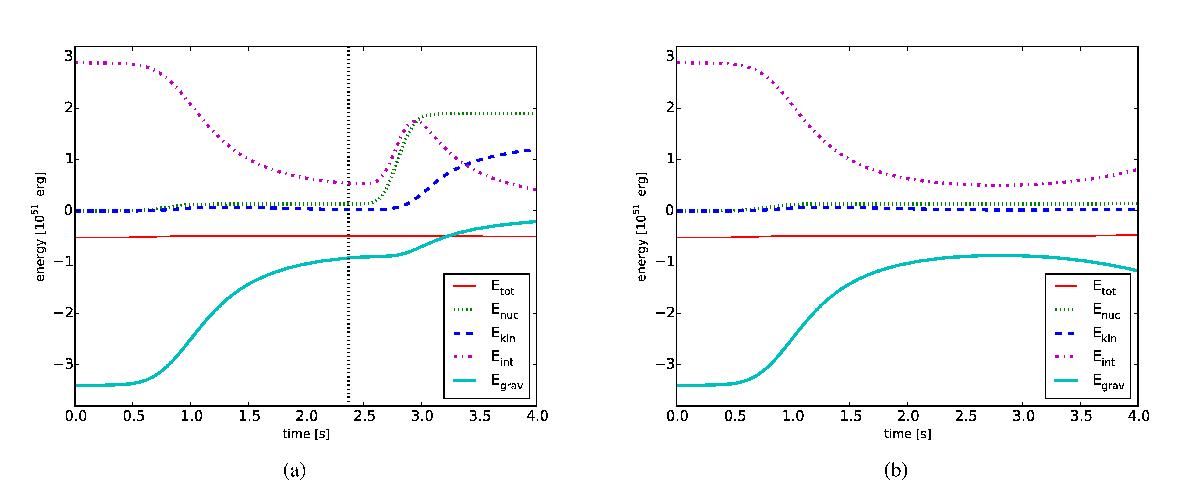
Temporal evolution of Etot, Enuc, Ekin, Eint, and Egrav. The left panel shows model GCD200. The vertical line marks the time at which the detonation is initialised. The right panel is for the corresponding pure deflagration case when no detonation is initiated.
This figure is made of several images, please see below:

Current usage metrics show cumulative count of Article Views (full-text article views including HTML views, PDF and ePub downloads, according to the available data) and Abstracts Views on Vision4Press platform.
Data correspond to usage on the plateform after 2015. The current usage metrics is available 48-96 hours after online publication and is updated daily on week days.
Initial download of the metrics may take a while.