Fig. 2
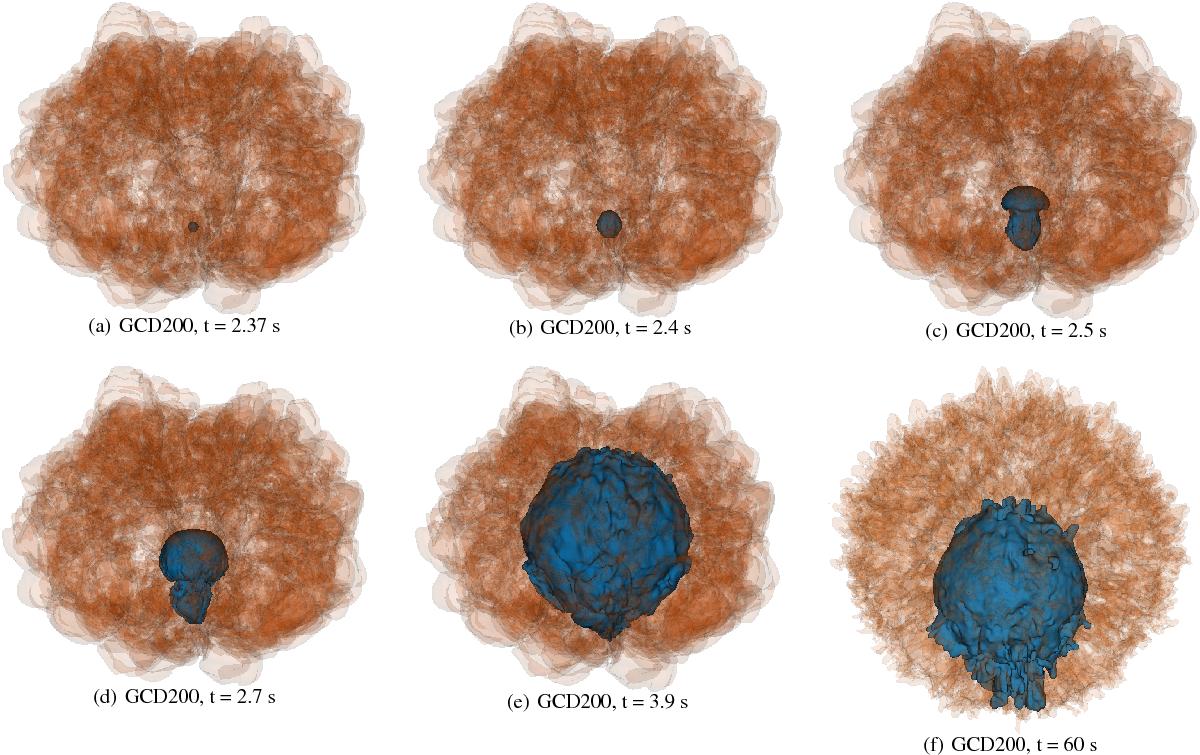
Evolution of the GCD200 model for six different instances of time. The deflagration level set is shown in red and the detonation level set in blue. Since the deflagration ashes almost completely surround the detonation, we have rendered the deflagration level set semi-transparent to allow visualizing the enclosed detonation front. The spatial scales in the plots are 1.23 × 1010 cm, 1.25 × 1010 cm, 1.33 × 1010 cm, 1.47 × 1010 cm, 2.46 × 1010 cm, and 1.59 × 1012 cm for panels a) to f), respectively.
Current usage metrics show cumulative count of Article Views (full-text article views including HTML views, PDF and ePub downloads, according to the available data) and Abstracts Views on Vision4Press platform.
Data correspond to usage on the plateform after 2015. The current usage metrics is available 48-96 hours after online publication and is updated daily on week days.
Initial download of the metrics may take a while.