Fig. 1
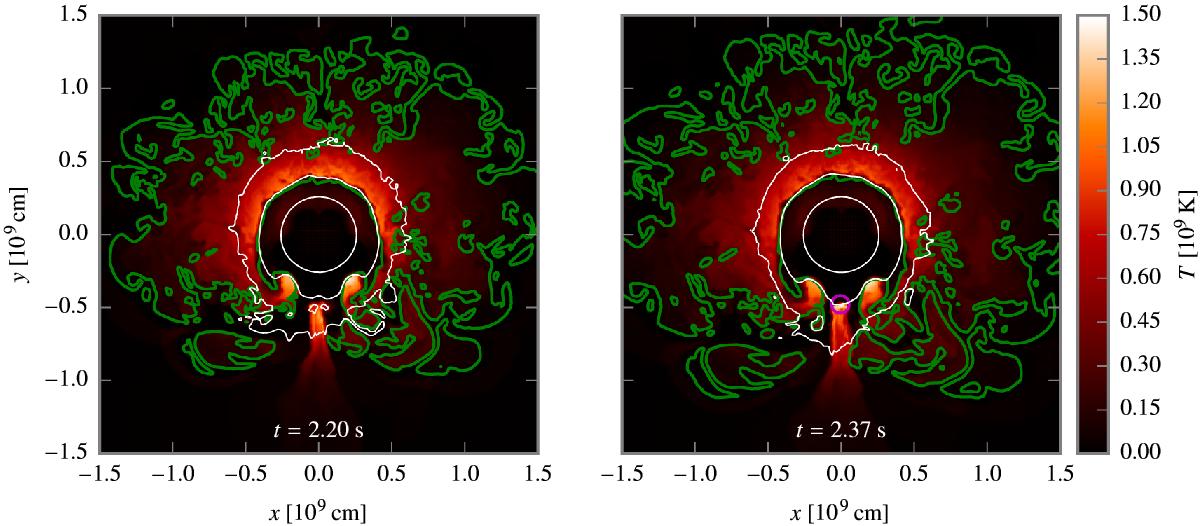
2D slice through the midplane of the simulation volume along the x- and z-axes for model GCD200 at t = 2.20 s (left panel) and at t = 2.37 s (right panel) with colour-coded temperature. The green contour line displays the position of the deflagration level set; any material enclosed by a green line has been burned in the deflagration. The white contour lines show the density at 107 g cm-3, 106 g cm-3, and 105 g cm-3 (from the centre outwards). The left panel shows the temperature slightly before the detonation is initialised, the right panel the temperature at the time of the initialisation of the detonation. The detonation spot is shown by a magenta circle (right panel).
Current usage metrics show cumulative count of Article Views (full-text article views including HTML views, PDF and ePub downloads, according to the available data) and Abstracts Views on Vision4Press platform.
Data correspond to usage on the plateform after 2015. The current usage metrics is available 48-96 hours after online publication and is updated daily on week days.
Initial download of the metrics may take a while.