Fig. 9
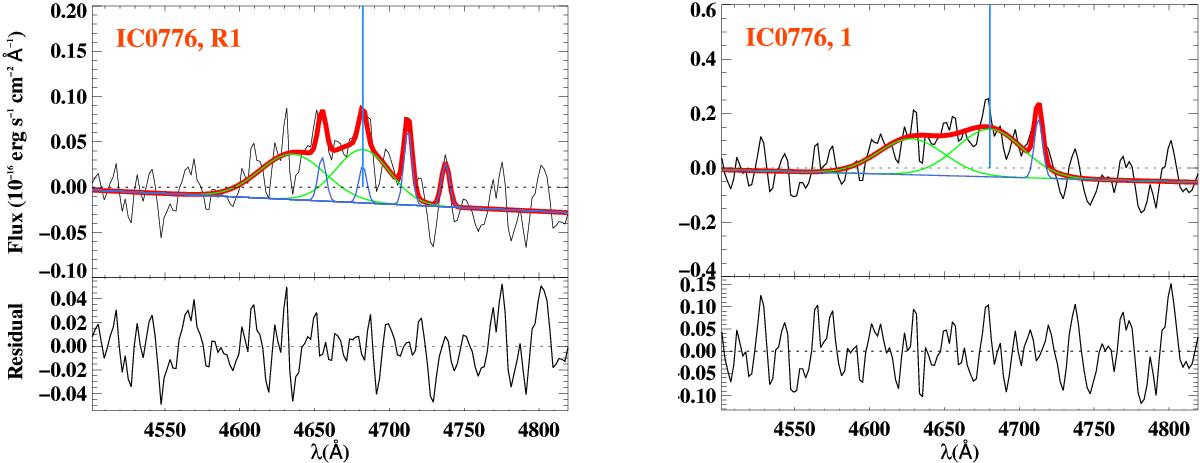
R1 in IC 0776 as typical example showing the effects of the dilution for the spectrum of the WR region (left) and for the spectrum of the associated Hα clump (right). Lines and colours are the same as in Fig. 7. Some structure is lost and fewer nebular lines are fitted when the WR feature is diluted. It is also noticeable that the broad lines widen.
Current usage metrics show cumulative count of Article Views (full-text article views including HTML views, PDF and ePub downloads, according to the available data) and Abstracts Views on Vision4Press platform.
Data correspond to usage on the plateform after 2015. The current usage metrics is available 48-96 hours after online publication and is updated daily on week days.
Initial download of the metrics may take a while.