Fig. 6
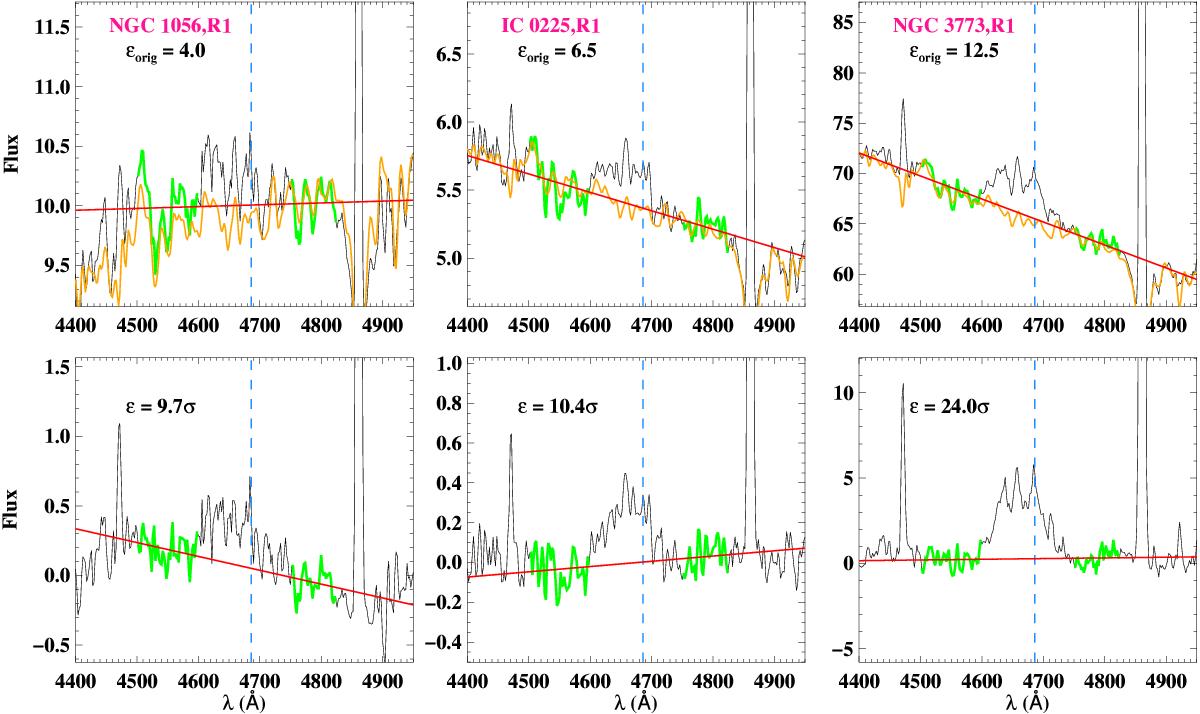
Examples of the integrated observed spectra around the blue WR bump for three selected regions: R1 in NGC 1056 (left), R1 in IC 225 (middle), and R1 in NGC 3773 (right). The blue vertical line shows the location of the He iiλ4686 line. The significance level (εorig) is given on the top left corner. The red solid line shows a linear fit to the continuum. The green sections of the spectrum correspond to those spectral ranges used to compute the rms. The fitted continuum spectrum with STARLIGHT is overplotted in orange. Bottom: the corresponding continuum-subtracted spectra derived for each of the three selected regions. The value of ϵ is provided in each case. The flux is given in units of 10-16 erg s-1 cm-2 Å-1.
Current usage metrics show cumulative count of Article Views (full-text article views including HTML views, PDF and ePub downloads, according to the available data) and Abstracts Views on Vision4Press platform.
Data correspond to usage on the plateform after 2015. The current usage metrics is available 48-96 hours after online publication and is updated daily on week days.
Initial download of the metrics may take a while.