Fig. 5
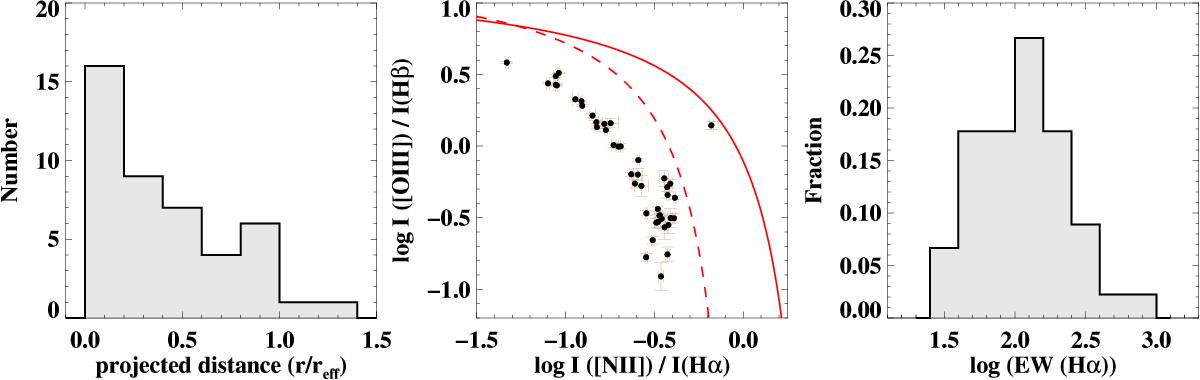
Left: distribution of the WR region projected distance to the galaxy centre, normalized to the effective radius of the galaxy. Middle: [O iii]λ5007/Hβ vs. [N ii]λ6583/Hα diagnostic diagram (usually called the BPT diagram as described by Baldwin et al. 1981) for the selected regions. The solid and dashed lines indicate the Kewley et al. (2001) and Kauffmann et al. (2003) demarcation curves, respectively. These lines are usually used to distinguish between classical star-forming objects (below the dashed line) and AGN powered sources (above the solid line). Regions between both lines are considered to be of composite ionizing source. Right: distribution of the observed equivalent width of Hα in logarithmic units for the selected WR regions.
Current usage metrics show cumulative count of Article Views (full-text article views including HTML views, PDF and ePub downloads, according to the available data) and Abstracts Views on Vision4Press platform.
Data correspond to usage on the plateform after 2015. The current usage metrics is available 48-96 hours after online publication and is updated daily on week days.
Initial download of the metrics may take a while.