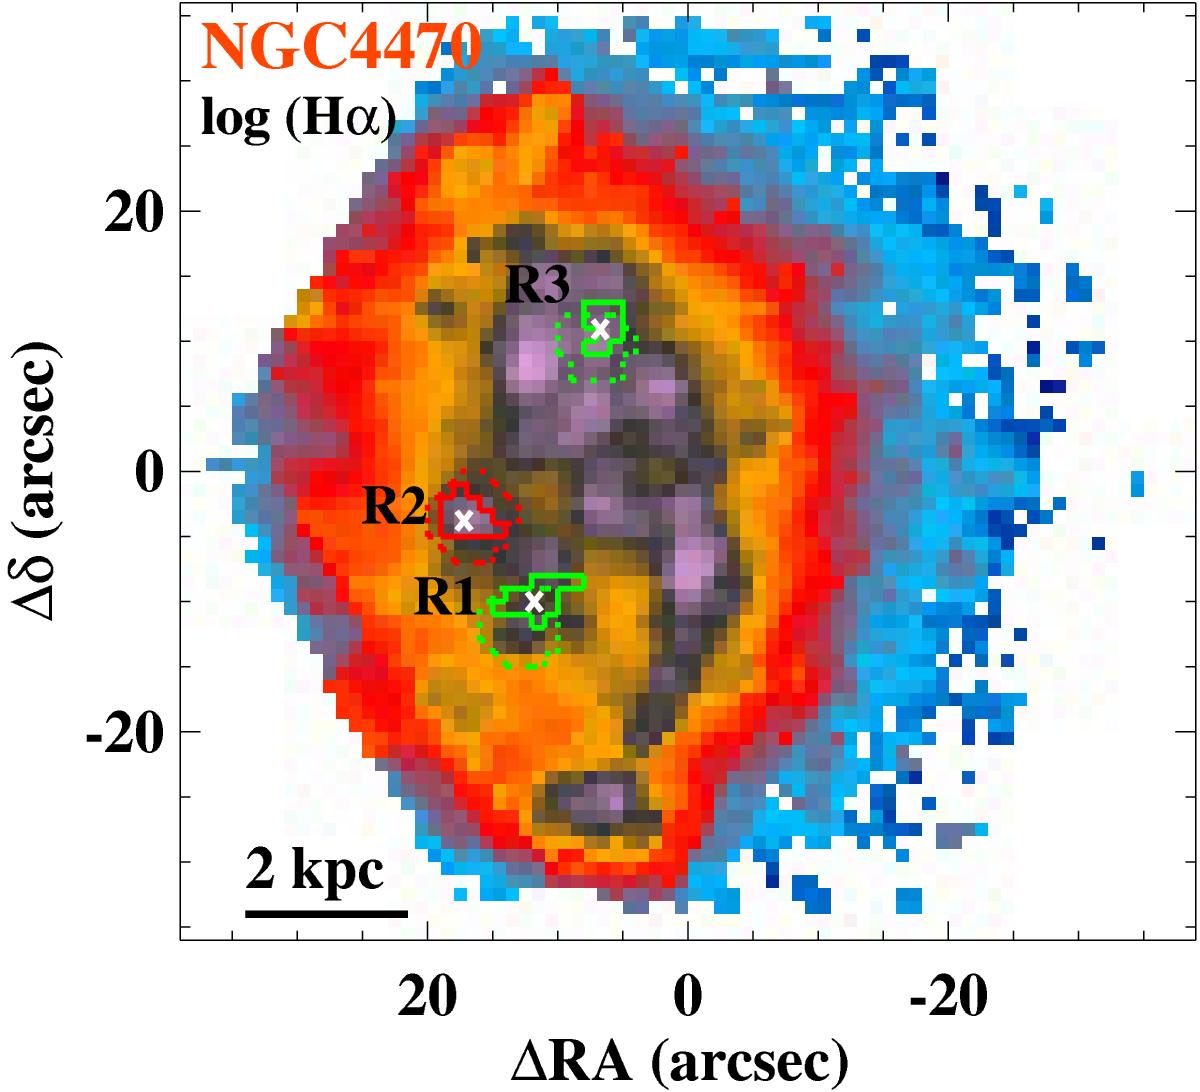
Fig. 4

Hα maps with logarithmic intensity scale of the galaxies with detected WR emission within the labelled regions enclosed by the green and red continuum contours. The pointed contours correspond with the associated Hα clump identified using HIIexplorer (Sánchez et al. 2012b), whenever the emission of the Hα clump is more extended than that of the WR region. A cross indicates the barycentre of the region. The scale corresponding to 2 kpc is drawn at the bottom left corner. North points up and east to the left.
Current usage metrics show cumulative count of Article Views (full-text article views including HTML views, PDF and ePub downloads, according to the available data) and Abstracts Views on Vision4Press platform.
Data correspond to usage on the plateform after 2015. The current usage metrics is available 48-96 hours after online publication and is updated daily on week days.
Initial download of the metrics may take a while.


