Fig. A.3
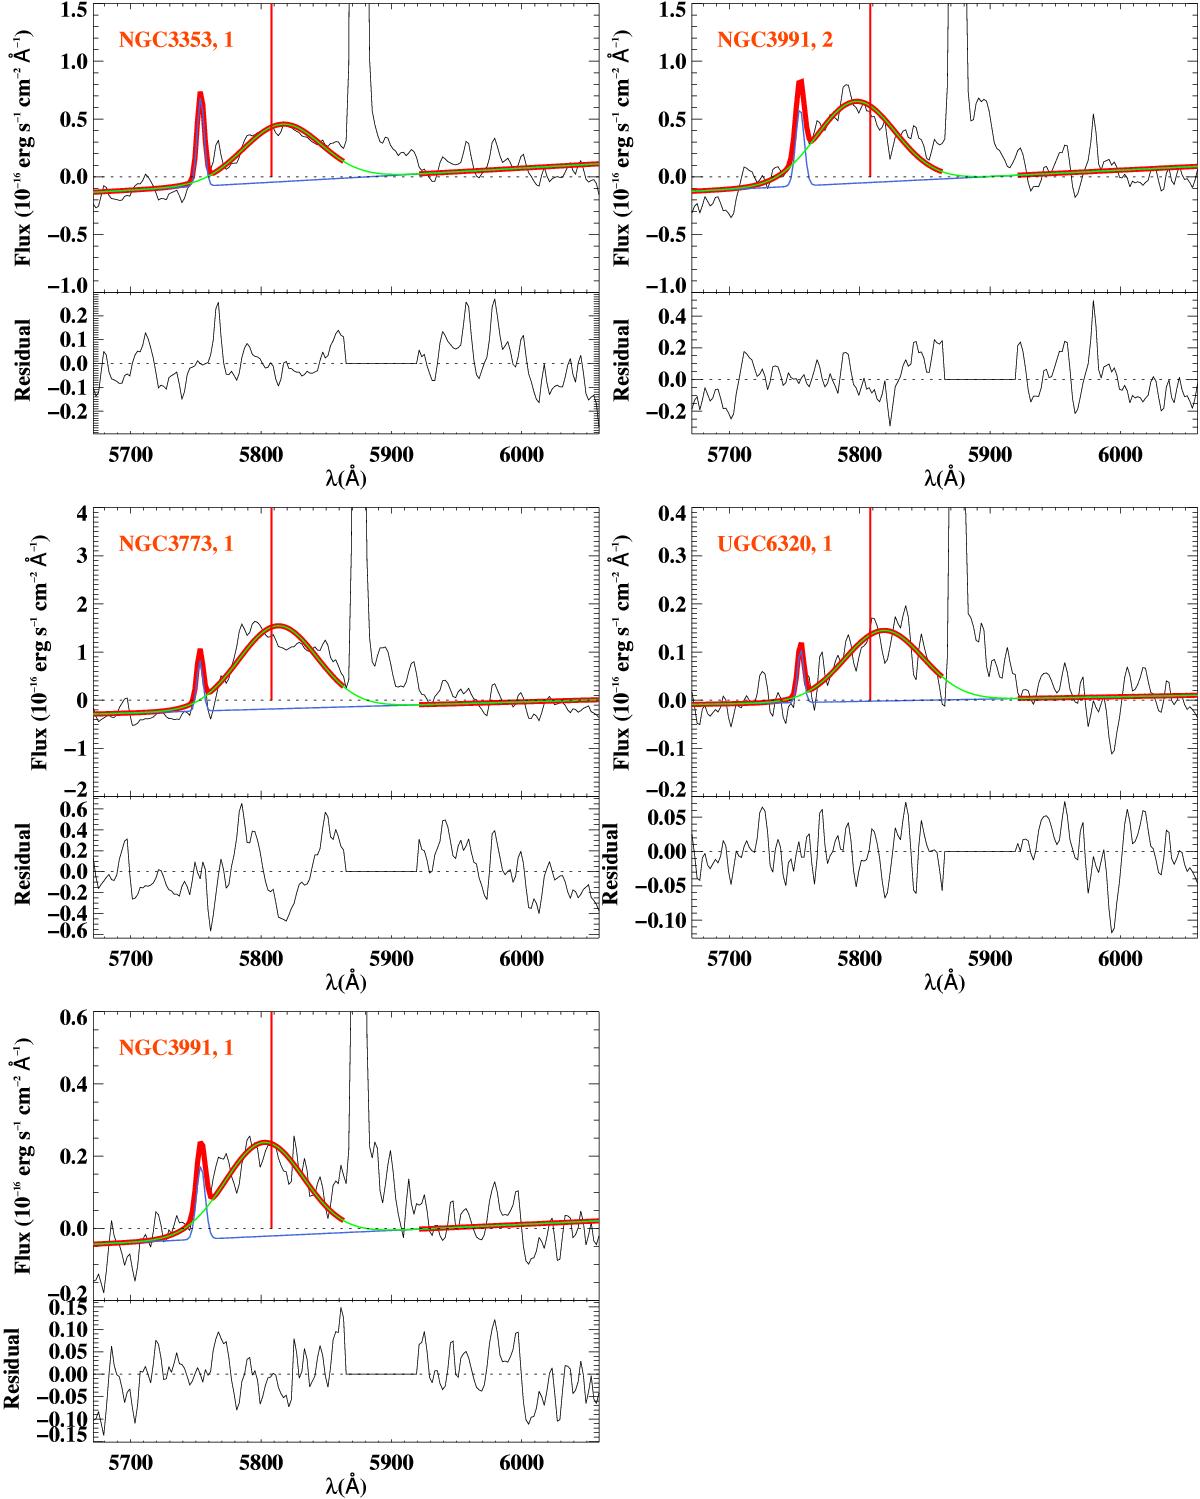
Multiple-line fit of WR features within the red bump. In each figure the residual spectrum is shown in black. This corresponds to the emission gaseous and stellar line spectrum minus the modelled feature in flux units. An almost horizontal blue line denotes the resulting continuum of the fit. The total fitted continuum plus emission lines to the blue bump is drawn with a thick red line. The fit to the auroral [N ii] 5755 Å line (blue) and broad stellar C iv 5808 Å feature (green) components of the fit are also drawn. The vertical red line indicates the position of the C iv 5808 Å feature.
Current usage metrics show cumulative count of Article Views (full-text article views including HTML views, PDF and ePub downloads, according to the available data) and Abstracts Views on Vision4Press platform.
Data correspond to usage on the plateform after 2015. The current usage metrics is available 48-96 hours after online publication and is updated daily on week days.
Initial download of the metrics may take a while.