Fig. 2
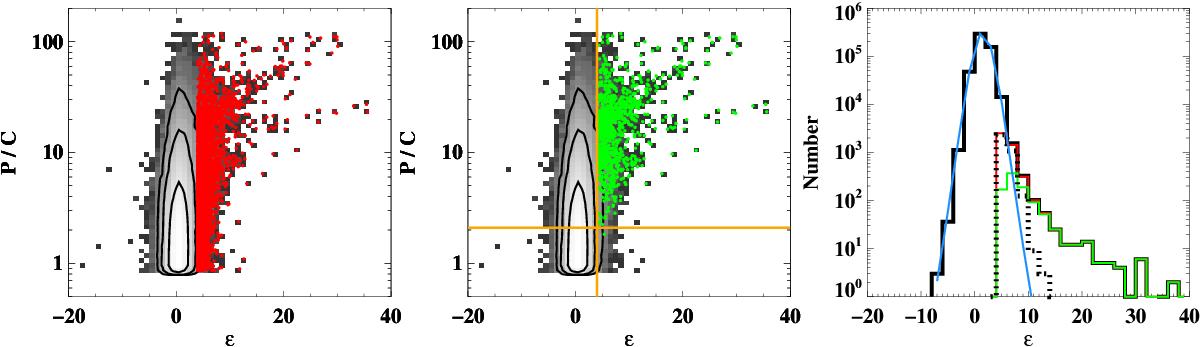
Left: density plot (grey scale) of P/C vs. ε parameters for all the pixels in the sample for which P/C > 0.85. Contours that contain 68% (1σ), 95% (2σ) and 99% (3σ) of the points are overplotted. Red dots correspond to the values of the pre-selected regions, i.e. before imposing the grouping of at least 9 pixels. Middle: same as before, but this time the overplotted green dots correspond to selected regions, also obeying the grouping criterion. The orange vertical line indicates the cut used for ε (4), while the horizontal line denotes P/C ~ 2.1 parameter, having practically all the selected pixels a higher value than this limit. Right: histogram of ε for pixels with P/C > 0.85 (black), pre-selected pixels (red), selected pixels (green), and for those pre-selected pixels not satisfying the grouping criterion (dotted black). The curve resulting from a Gaussian fit of the black histogram is overplotted in blue.
Current usage metrics show cumulative count of Article Views (full-text article views including HTML views, PDF and ePub downloads, according to the available data) and Abstracts Views on Vision4Press platform.
Data correspond to usage on the plateform after 2015. The current usage metrics is available 48-96 hours after online publication and is updated daily on week days.
Initial download of the metrics may take a while.