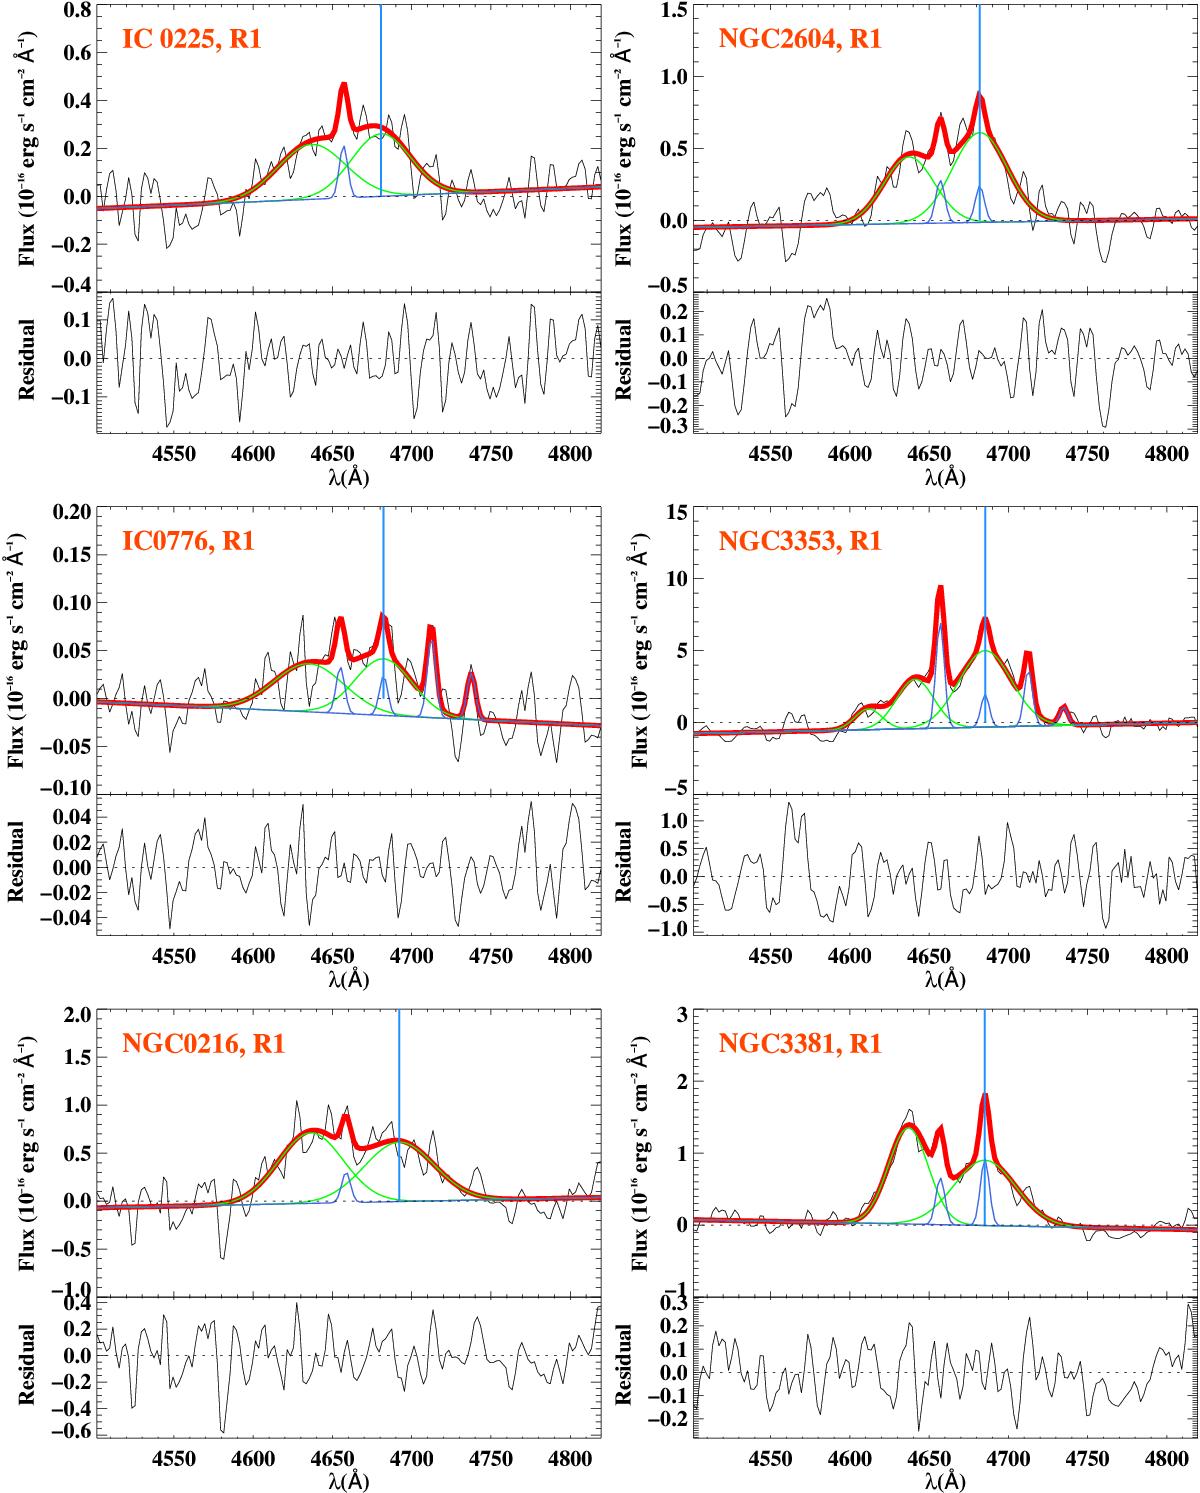
Fig. A.2

Multiple-line fit of WR features within the blue bump. An almost horizontal blue line denotes the resulting continuum of the fit. The total fitted continuum plus emission lines to the blue bump is drawn with a thick red line. The nebular (blue) and broad stellar (green) components of the fit are also drawn. The vertical blue line indicates the position of the He ii 4686 Å line. In each case, an auxiliary plot shows in black the residuals (in flux units) after modelling all the stellar and nebular features. For the case of NGC 7469, the fitting has been carried out on the observed spectrum, as explained in the text.
Current usage metrics show cumulative count of Article Views (full-text article views including HTML views, PDF and ePub downloads, according to the available data) and Abstracts Views on Vision4Press platform.
Data correspond to usage on the plateform after 2015. The current usage metrics is available 48-96 hours after online publication and is updated daily on week days.
Initial download of the metrics may take a while.


