Fig. 10
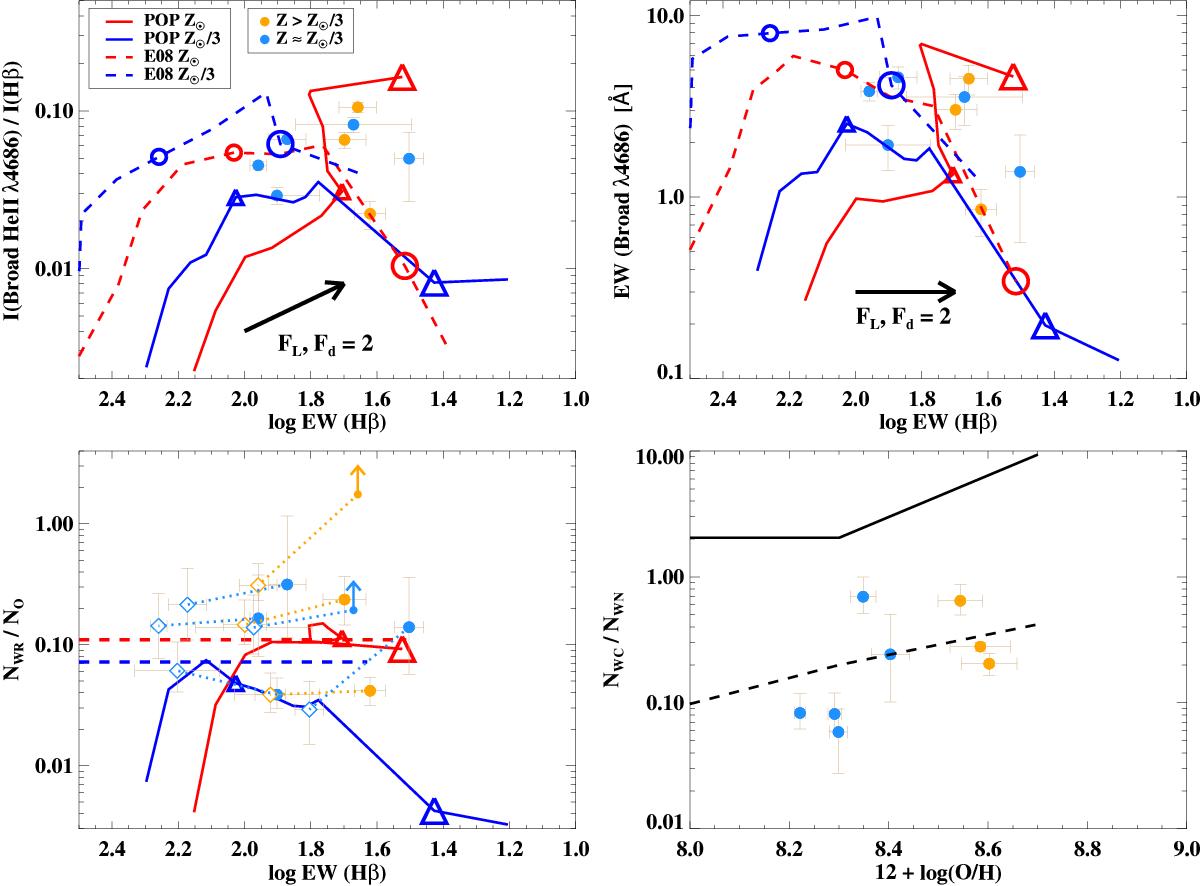
Top: intensity ratio of the He ii 4686 Å broad line to Hβ (left) and the EW of the broad line (right) vs. EW (Hβ ), a good indicator of the age of young ionizing populations. The data are coloured depending on their metallicity. Tracks from POPSTAR (solid line; simple population) and BPASS (dashed line; binary population) are shown in different colours also depending on the metallicity. Open triangles indicate the values for 4.5 (small triangles) and 5.5 Myr (large triangles), respectively, on the POPSTAR tracks. Open circles indicate the values for 6 (small circles) and 12.5 Myr (large circles), respectively, on the BPASS tracks. The arrows labelled as FL = 2 and Fd = 2 illustrate how the tracks would move on the plot if half of the ionizing photons actually escape the ionized regions or are absorbed by dust grains within the H ii region. Bottom left: derived ratio of the number of WRs over the number of O stars vs. EW(Hβ ). Lower limits are provided for R1 in NGC 3381 and NGC 3773. Open diamonds show how the data would move in the plot if half of the photons escaped or were absorbed (the dotted lines connect each case); here, the upper limits disappear because with the increased Hβ flux , the derived number of O stars is not negative any more. The tracks from the BPASS models are completely horizontal because the only average values over the time of the WR phase are provided. Bottom right: ratio of the derived number of WC over WN stars vs. metallicity. Solid (dashed) line indicate the track for the POPSTAR (BPASS) model.
Current usage metrics show cumulative count of Article Views (full-text article views including HTML views, PDF and ePub downloads, according to the available data) and Abstracts Views on Vision4Press platform.
Data correspond to usage on the plateform after 2015. The current usage metrics is available 48-96 hours after online publication and is updated daily on week days.
Initial download of the metrics may take a while.