Fig. 1
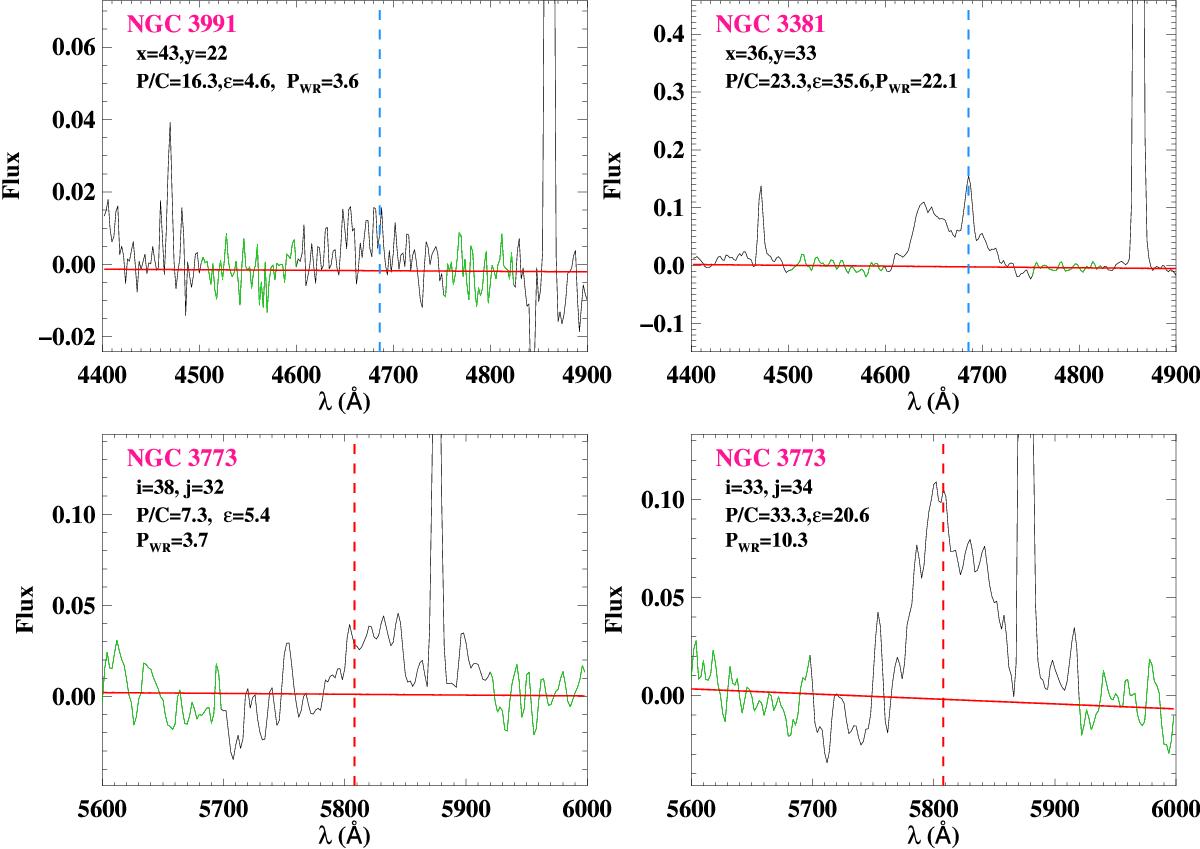
Top: examples of continuum-subtracted spectra for a given pixel in NGC 3991 and NGC 3381 around the blue WR bump spectral range. The blue vertical line shows the location of the He iiλ4686 emission line. The spatial coordinates of the pixels (x and y) and the P/C, ϵ, and PWR parameters defined in the text are given on the left-top corner of each panel. A red continuous line indicates a linear fit to the continuum (which ideally should be an horizontal line at y = 0). The green sections of the spectrum correspond to those spectral ranges used to compute the rms. Bottom: examples of continuum-subtracted spectra for a given pixel in NGC 3773 around the red WR bump spectral range. The red vertical line indicates the location of the C ivλ5808 emission line. The coordinates of the pixels and their associated parameters are also given on the left-top corner. In both the blue and the red WR bump cases one spectrum at the limit of the detection level (left) and another with a very good detection level (right) are shown. The flux density is given in units of 10-16 erg s-1 cm-2 Å-1.
Current usage metrics show cumulative count of Article Views (full-text article views including HTML views, PDF and ePub downloads, according to the available data) and Abstracts Views on Vision4Press platform.
Data correspond to usage on the plateform after 2015. The current usage metrics is available 48-96 hours after online publication and is updated daily on week days.
Initial download of the metrics may take a while.